Creating Customer Value with Lean
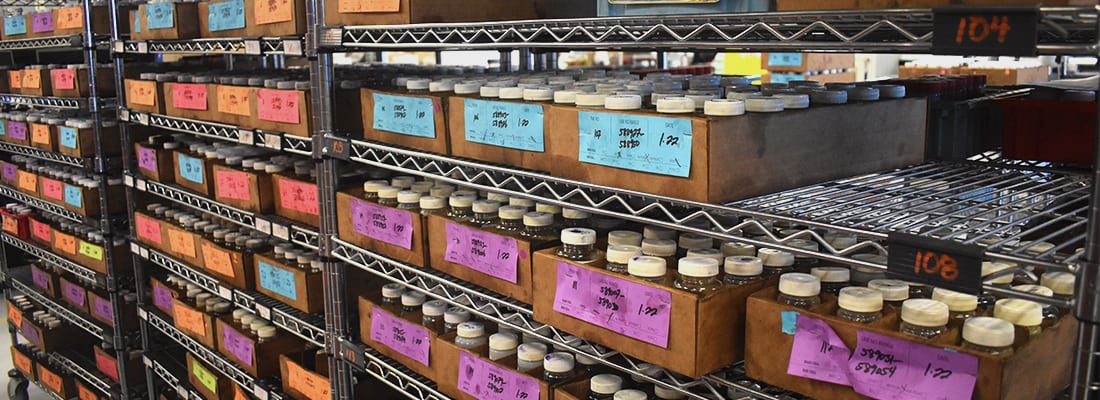
As a leading fluid analysis laboratory – we strive to meet our customers needs and exceed their expectations. Our fluid analysis laboratories operate under Lean principles – maximizing customer value while minimizing waste. Simply put, this means we create more value using fewer resources. The Lean ideas, principles and standards were originally created by Toyota to eliminate waste and inefficiency in its manufacturing operations. The process became so successful that it has been embraced in manufacturing sectors around the world – POLARIS Laboratories® included. We fully embrace and operate under Lean principles in all six of our laboratory locations.

So, how do we ensure our laboratory is operating efficiently and effectively through these principles? Some of the practices, standards and initiatives we have implemented to support a Lean laboratory environment are below.

Efficient work flow, standard work and performance management:

  • No walls or separation of testing areas – this promotes flexible operations and the sharing of workloads and resources.
  • Visualization of workloads at each test station.
  • Workplace design – this allows the combination of tests to create balanced, productive technician workloads and standard work while reducing waste of motion and energy.
  • Visual management of laboratory performance (for example, TV monitors display current work performance and performance over time. These metrics are monitored and reviewed daily).

Effective use of staff time and minimizing waste of motion:

  • Adjacent and accessible conference and huddle rooms that encourage collaboration.
  • Areas dedicated specifically to write-ups, reviews and approvals provides timely documentation.
  • Laboratory test stations are in close proximity to sample processing, ensuring a quick transfer of samples from receipt to testing stations.
  • Central location of parts and consumables near test stations.

Maximize future configurability:

  • The building’s HVAC and electrical systems are set up in a grid system – allowing stations to be moved easily if necessary.
  • Test stations equipped with wheels allow for quick and easy reconfiguration.

Lean behaviors and communication:

  • Glass walls between support staff and operation staff offers an open-office feel.
  • Laboratories are equipped with Process Improvement Boards throughout.

Support workplace organization and “5S”:

5S goes hand-in-hand with Lean principles (Sort, Set in Order, Shine, Standardize, Sustain) and improves workplace efficiency and eliminates waste.

  • All laboratory workstations are identified with labels for designated supplies.
  • Easily identifiable color-coded sample trays provide effective sample management, processing and testing.
  • Workstations equipped with 5S checklist – which is reviewed and approved daily.
  • Designated storage and organization throughout the laboratory.

By ensuring our laboratory facilities, staff and testing stations align with Lean principles, we continue to provide maximum value to our customers – saving time and money – and more of their equipment.


Dustin 

Senior Manager of Laboratory Operations


Proven Impact. Proven Uptime. Proven Savings.
Let us prove it to you.

Published May 29, 2018

3 Ways to Achieve Program Success

Oil analysis will not and should not replace good, everyday maintenance practices. If used properly, oil analysis becomes a valuable diagnostic tool that can reduce maintenance costs, increase productivity and boost company profits. When used in conjunction with diagnostic tools such as vibration analysis, ultra sound and thermography, oil analysis can detect a variety of problems before they become failures. This gives users the valuable time necessary to make decisive, well-informed maintenance decisions. But often times, this is easier said than done. I’ve outlined a few ways to help your program be successful and reach its full potential:

  1. Set Realistic Goals

    • Set productive, attainable goals by which you can measure the success of your program and examine your current maintenance program.
      • What is your maintenance strategy and what, if anything, does it accomplish?
      • How do you measure that accomplishment?
    • Do you want to:
      • Monitor the condition of the lubricant?
      • Monitor the condition of the equipment?
      • Monitor the condition of the lubricant and the equipment?
      • Monitor system cleanliness?
      • Monitor contamination and wear?
      • Adopt a proactive maintenance strategy vs. a reactive one?
      • Extend oil drain intervals?
      • Reduce downtime?
      • Prevent/reduce failures?
      • Extend equipment life expectancy?
  2. Set Realistic Expectations

    • What would it mean to your company financially to reduce downtime by 20%? Extend drain intervals by 25%? Reduce failures by 15%? Increase equipment life by 10%? How much money could be saved by becoming proactive as opposed to reactive? Affect change in your everyday maintenance practices by performing minor maintenance as often as necessary to avoid failure and ALWAYS act immediately on critical samples.
  3. Measure Your ROI

    • Measuring the effectiveness of your oil analysis program can easily justify its cost, or ROI, to management. To do this: determine your savings in increased uptime, reductions in oil consumption, labor parts replacement and compare that to the cost of doing oil analysis. Seeing these savings can help determine if your program is successful.

Setting both realistic goals and expectations and then measuring your return on investment can help you determine if your program is maximized and functioning as it should, and allows you to re-evaluate those goals if necessary.

Proven Impact. Proven Uptime. Proven Savings.
Let us prove it to you.
Published May 22, 2018

Is Your Program Losing Momentum?

Maintaining a successful program comes with challenges

Maintenance teams jump over countless hurdles and experience numerous challenges while building an efficient predictive maintenance program. These hurdles and challenges can result in the maintenance program slowly losing it’s momentum. Below, I’ve outlined some common reasons we see that could explain why maintenance programs may not live up to their potential and be maximized fully:

  • Budget | maintenance program is the first budget to get reduced
  • Leadership Changes | executive management changes can result in new overall maintenance goals
  • Loss of Value| the company may no longer see value in their predictive maintenance program

At POLARIS Laboratories®, we strive to establish, achieve and maintain rapport with our customers and who we call Program Champions. These Program Champions are true believers in the benefits, cost savings and increasing equipment reliability resulting from an effective fluid analysis program. As an Account Manager, I see the above reasons and changes occur more frequently than you would expect. Often times, when maintenance programs lose their momentum and begin to dwindle, the entire process for establishing a Program Champion and a routine, effective fluid analysis program starts over. Although this provides a struggle for us as a partner you as a customer – we see this as an opportunity to educate the maintenance team and executive level leadership on the importance of a successful predictive maintenance program while incorporating fluid analysis.

What do you do if your predictive maintenance program loses its momentum?

There are companies that provide solutions and services – whether it be a consulting firm or equipment manufacturer – for improving maintenance programs but ultimately, the customer is responsible for implementing the solutions and maintaining them.

Below are some practical ways to keep your predictive maintenance program from losing momentum – by utilizing existing resources.

  1. Establish a Program Champion who sees the value in improving equipment reliability who can train the maintenance team to maximize and execute the program.
  2. Keep in constant communication with the fluid analysis and other service providers.
  3. Partner with a reliable, accredited fluid analysis laboratory who can help the end user monitor their equipment’s condition before it becomes critical.

Overall, it’s important to overcome these hurdles and maintain your maintenance program, it could save you both time and money in the end. And, let’s face it – can your equipment afford not to?

Proven Impact. Proven Uptime. Proven Savings.
Let us prove it to you.

Published May 8, 2018

From the Expert: Effects of Varnish

Varnish is a gel-like substance that adheres to metal surfaces and can cause hot spots, increase in machine temperature and can result in filter plugging, micro-dieseling and can cause catastrophic failure. It’s important to test for varnish on turbines, compressors, hydraulics and large circulation and lube systems. We’ve turned to our expert, CLS and OMA I certified Data Analyst, Elaine Hepley, to explore varnish and the Membrane Patch Colorimetry (MPC) test conducted to detect it as well as two other tests that can help identify varnish formation potential.

  • Membrane Patch Colorimetry (MPC) ASTM D7843
    • MPC is a test designed to capture any presence of varnish that is soluble with the oil. This test is performed by heating the sample to 60 to 65 degrees Celsius for 23 to 25 hours. The sample is then placed in the dark away from UV light for 68 to 76 hours. After the incubation period, the sample is mixed with Petroleum Ether and stirred for 30 seconds to allow a complete mixture and then filtered onto a 47mm, 0.45-micron-size membrane patch.
    • The patch is placed in a location free of dust and heat and air-dried for about 3 hours. Once the patch has been dried, a colorimeter is used to detect the color of the patch and the CIE Lab ΔΕ and L*a*b* calculations are used to report the color of the patch. The color and severity scale is as follows:
      • 0-14.99: Severity 0 – Very low potential for varnish formation
      • 15-19.99: Severity 1 – Minor potential for varnish formation
      • 20-29.99: Severity 2 – Moderate potential for varnish formation
      • 30-39.99: Severity 3 – Significant potential for varnish formation. Preventative measures should be taken to stop the continuous formation of varnish
      • >40: Severity 4 – Severe and evident formation of varnish in system, and action must be taken to remove varnish.
    • The lighter (whiter) the color of the patch, the lower the MPC value and the darker (amber) color of the patch, the higher the MPC value.
    • PLEASE NOTE: Gray discoloration of the patch can be attributed to micro-dieseling or static discharge in the filters.
    • MPC testing can be performed on turbines and other unit types such as compressors, hydraulics, large circulation and lube systems.
  • Linear Sweep Voltammetry (LSV) ASTM D6971
    • LSV uses a voltage reading to detect the presence of anti-oxidants amines and phenols. The test is performed using an alcohol/acetone based solution (yellow or green) to help draw out the anti-oxidants from the oil. An electrical current is introduced to the sample and reveals the presence of amines and phenols in a matter of seconds. The results of the used oil are compared to a standard (new lubricant levels) and the differences/changes in the anti-oxidants in percentage are reported.
    • Some formulations are composed of amine, phenols or both. Phenols are considered to be the “sacrificial anti-oxidant” when formulated in conjunction with amines. The role that the phenols have is to be the first to deplete. This leaves behind amines to stabilize and keep the potential for varnish at bay.
    • That is not to say that phenols are a weak anti-oxidant. In a phenol-only formulation, the phenol is formulated to hold its presence and not deplete as rapidly when formulated with an amine. The same rule would apply to an amine-only formulation. These anti-oxidants help keep the free radical oxides from taking over the system and creating “varnish”. Anti-oxidants help sustain a healthy operational life for the equipment.
    • It has been discovered that as these anti-oxidants deplete, the potential for varnish is eminent and action should be taken to help remove the varnish from the system entirely.
  • Rotating Pressure Vessel Oxidation Test (RPVOT) ASTM D2272
    • RPVOT was designed to measure the oxidation stability of a turbine oil in minutes. The lubricant is placed in a vessel containing a polished copper coil. The vessel is charged with oxygen and then placed in a bath heated to a constant temperature of 150 °C. The vessel rotates while submerged in the bath and will stop once a drop of 25.4 psi is reached from maximum pressure.
    • When the test is complete, the RPVOT results are divided by the starting value RPVOT of the new lube to calculate the overall percentage of remaining useful life.
    • Calculation %=RVOT test result ÷ RPVOT new lube
      • Values of >55% are within the acceptable limits for the method and no action is needed.
      • Values of 55-45% are approximately half of the products starting life and sweetening is recommended.
      • Values of 44–26% indicate low oxidative stability. The possibility for sludge formation and discoloration is likely, and sweetening the sump is recommended.
      • Values of <25% is an indication the oxidative stability is extremely low and change of lubricant is advisable.
    • RPVOT testing is essential to for turbine oils this test helps determine when to schedule downtime and maintenance actions.

It is believed that as the antioxidants deplete, there is an increased potential for varnish formation. LSV Ruler testing is recommended to help monitor the antioxidant properties as well as the presence of varnish formation via MPC. As these antioxidants deplete, the presence of varnish forming can be captured on the MPC. These two tests can be used to help correlate any decreases or increases in antioxidants and monitor any changes/improvements with the presence of varnish. The same correlation can be used with RPVOT as the values decrease or are <44% the potential for varnish formation.

Click here for a complete list of testing performed by POLARIS Laboratories®

Proven Impact. Proven Uptime. Proven Savings.
Let us prove it to you.

Published May 1, 2018