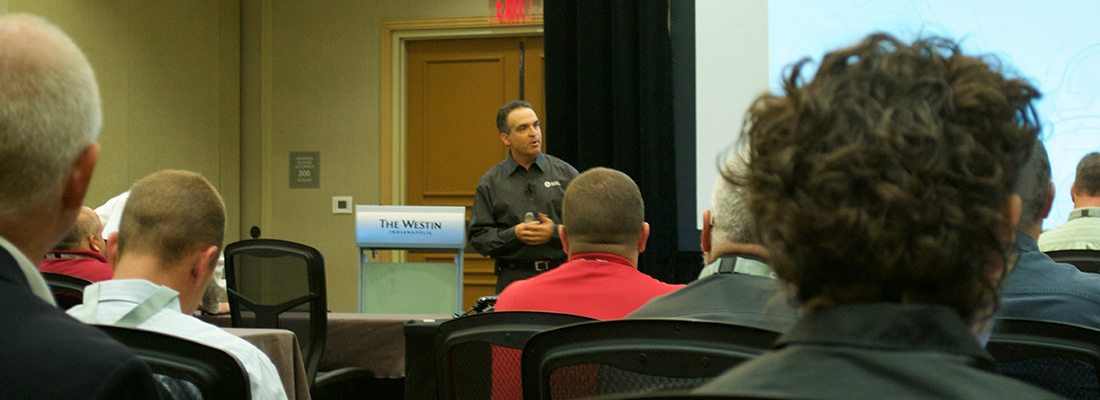
 The 2015 POLARIS Laboratories Customer Summit has an amazing lineup of speakers to demonstrate how oil analysis helps drive
action inside their maintenance programs.
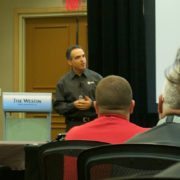
Likewise, keynote speaker David Cripps, chief engineer for HERTA Racing, will bring a unique perspective to the summit. POLARIS Laboratories® sat down with Mr. Cripps for a preview of what’s in store for Customer Summit attendees.
POLARIS Laboratories: At what moment did you realize the money- and equipment-saving potential of oil analysis?
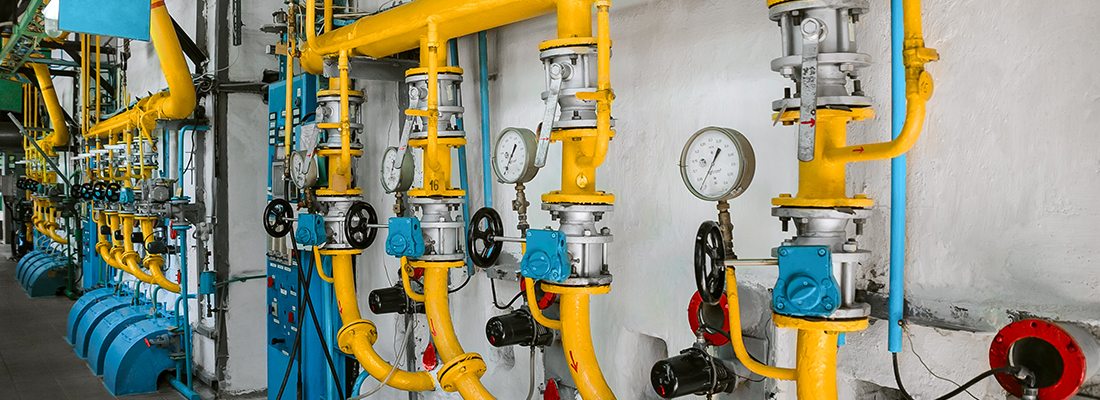
David Cripps: In racing, the key performance area we’re concerned with is drag, and there’s a tremendous amount of drag within the mechanical components. Lots of R&D goes into finding bearings and coatings that minimize the drag. Mostly, it’s accomplished by lowering lubricant viscosity as much as possible without lowering the life of the equipment. Oil analysis is an important piece of the process – especially when evaluating the wear on the equipment.
PL: What is the one piece of advice you wish every oil analysis user would follow?
DC: Data is king. It’s extremely important. People will acquire loads of data thinking they’ve done their job. But data processing is what’s important. You need a data reduction process – to collate it. You need to paint longer-term pictures, to refine the data.
PL: What’s the best oil analysis “save” you have experienced?
DC: That’s actually a story I’m going to talk about during the Customer Summit. I don’t want to give too much away, but I’ll give you a quick preview: Assume nothing.
PL: How did you end up coming to Indianapolis, and what do you think of the city?
DC: [Former IndyCar driver] Dick Simon personally invited me to work for him in Indy. He was a great guy and he had a growing racing team. That’s when I began laying down roots in the city. 20 years later, Indianapolis has changed a lot. It’s an impressive, well-run city. The downtown went through a huge renovation, and now it’s a clean, attractive place people want to hold events at, like this summit. The city is more than just racing – there’s a good cross-section of business with a little bit of everything.
Hear more from David Cripps during the 2015 POLARIS Laboratories Customer Summit. Register for the summit before July 16 and save $200.
Proven Impact. Proven Uptime. Proven Savings.
Let us prove it to you.
Published July 6, 2015