Changing Ourselves to Drive Customer Success

POLARIS Laboratories® embraces change because it is the only way to continuously improve the value of our oil analysis. Some changes are driven by feedback from employees, but often it’s the voice of the customer that drives us to become better.
Each month we send surveys to customers to discover what we are doing well and what needs improvement. Recently, survey comments requested more information in our results comments to help maintenance programs diagnose what is causing abnormal conditions in their equipment.
We took a closer look at our report comments. Wear and contamination comments contained quite a bit of information on potential causes and how to correct the problem, but fluid property comments lacked some of these details.
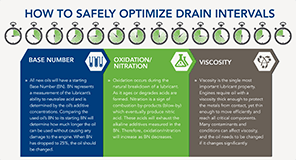
Our customers pointed out a valid area to improve, so improve it we did. Comments on viscosity, acid number, base number, pH, oxidation and nitration now include more details and possible root causes.
Our ultimate goal is for customers to be confident they are making the right maintenance decisions based on their analysis results. Expanding the report comments is one way we’re helping customers save their equipment.
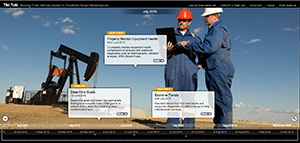
Log into HORIZON and open a recent report to see the expanded comments for yourself.
Proven Impact. Proven Uptime. Proven Savings.
Let us prove it to you.

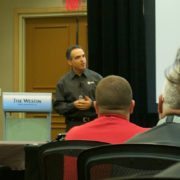
 The 2015 POLARIS Laboratories Customer Summit has an