Program Reviews

Moving beyond the individual fluid analysis report is an essential step to maximize the value of your fluid analysis program and reduce reactive/unscheduled maintenance events within your organization.

While many customers understand the value of identifying and addressing the root cause of high severity reports or frequent component failures, finding the time and resources can be a real challenge. By enlisting the help of POLARIS Laboratories® Technical Business Consultants, reaching or exceeding your maintenance goals is easier than you might think. With an in depth look at your program, we identify the common causes of your high severity reports and provide solutions to your maintenance challenges.

Instead of examining individual sample reports to discover what maintenance activity needs to happen, program enrichment reviews look at all of the test results over a month, a year or several years. We identify the top 3 or 4 issues that that should be prioritized in your maintenance activities to reduce the number of high severity reports. The reviews also highlight what current maintenance practices are working best for your organization by examining the low severity reports.

Maintenance managers commonly find value in program enrichment reviews by:

  1. Reviewing component sample submission and frequency to ensure you’re testing everything you intended to test
  2. Identifying maintenance issues
  3. Identifying possible trends in mechanical failures
  4. Identifying possible fluid issues and optimizing drain intervals
  5. Identifying and sharing maintenance best practices
  6. Quantifying their fluid analysis program’s impact on equipment uptime and lowering maintenance costs

How often a program enrichment review is performed will depend on your equipment, industry and maintenance goals. Typically, company-wide reviews occur once per quarter.

If this type of program evaluation sounds right for you, please contact me so we can discuss the review frequency and goals of your program enrichment review. There is no “one size fits all” program enrichment review, each is customized specifically for the individual customer. POLARIS Laboratories® can help you set a review schedule and help create the goals that are right for you.

Proven Impact. Proven Uptime. Proven Savings.
Let us prove it to you.

Published July 25, 2017

What is particle count?

Finding Diesel Fuel Contamination Early

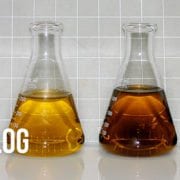
Poor fuel quality and contamination can stop engines from running, which can strand shipments on the road, halt work on production lines or stop electricity from being generated during outages. Fuel can become contaminated or lose quality in many ways:

  • Exposure to water
  • Extreme heat or cold
  • Biological contamination (bacterial, fungi and mold)
  • Mixing low quality and contaminated fuel with clean fuel

Testing diesel fuel will detect if there is a problem, diagnose the cause of the problem and suggest a treatment to restore the fuel to a usable condition.

To learn more, download this solution sheet.

Proven Impact. Proven Uptime. Proven Savings.
Let us prove it to you.

Published June 13, 2017

Testing Your Oil Conditions

Contamination, component wear and fluid degradation make oil changes necessary. However, we have a choice when to change it.

Maintenance managers can set oil drains based on the equipment manufacturer’s recommendations, but that doesn’t necessarily account for unique environmental conditions. A heavy duty diesel engine on a piece of mobile equipment at a surface mine has different operational conditions than the same engine model in a standby power generation application. Oil analysis from POLARIS Laboratories® provides the scientific data to determine if a drain is necessary or if the drain interval can be extended.

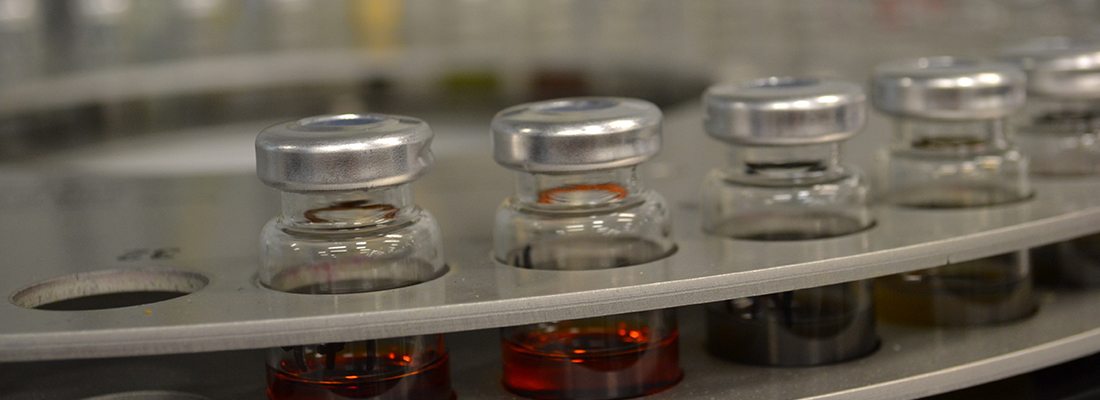
But oil analysis by POLARIS Laboratories® covers more than just extending drains. Tests can determine abnormal component wear and fluid degradation. Here are a few of the oil conditions that are measured through our oil testing:

  1. Wear Metals: Components wear as they operate. This wear debris is abrasive and will beget additional component wear as the abrasive particles are circulated via the lubricant. The quantity and type of metal in the lubricant can identify how much wear is occurring and which part is wearing.
  2. Viscosity:  A measure of the lubricant’s resistance to flow at temperature. It is considered the most important property of a lubricant because it indicates film strength. Lubricants need to be within a certain viscosity range to provide adequate lubrication and prevent wear.
  3. Water Content: The amount of water contamination present. Water causes component corrosion and is a catalyst for oxidation.
  4. Soot: Particulate created as a by-product of incomplete combustion. Excessive soot levels will cause abrasive component wear.
  5. Fuel Dilution: Amount of unburned fuel in the lubricant. Excessive fuel dilution lowers the flash point and the viscosity, which results in friction-related wear.
  6. Acid Number: Used to measure the relative amount of acids in the lubricant, which can lead to lubricant degradation, and the potential for increased component wear.
  7. Base Number: A measure of a lubricant’s alkaline reserve, which can indicate the ability to neutralize acids.
  8. Oxidation: A way to measure the breakdown of the lubricant due to age and operating conditions. Oxidation promotes the formation of acids, which leads to lubricant degradation, and the potential for increased component wear.
  9. Nitration: Degradation that occurs when nitrogen oxides react with the lubricant primarily from ventilation (blow-by). Nitration leads to formation of sludge and varnish.

Of course, these are basic tests. Many different types of tests are available for special lubricant types or to gather more information on contamination found by another test.

Oil testing is even more helpful when the lubrication is used with other in-line fluids, such as coolant and diesel fuel. Engines use all three fluids, and a problem with one can affect another. Adding coolant analysis and diesel fuel analysis will uncover problems that would normally go undetected with oil analysis alone.

Proven Impact. Proven Uptime. Proven Savings.
Let us prove it to you.

Published May 2, 2017

Schedule Sample Reports to Optimize Your Program and Save Time

HORIZON® Management Reports can be automatically delivered to your inbox so you can better manage your fluid analysis program. After a report is generated, the criteria can be saved and scheduled to be sent daily, weekly, monthly or annually.

The following reports can be scheduled for delivery in HORIZON:

  • Severity Summary Report
  • Sample Schedule Report
  • Sample Volume Report
  • Sample Frequency Report
  • Turnaround Time Report
  • Equipment List
  • Data Extraction Tool
  • Problem Summary Report
  • Program Condition Report
  • Action Taken Summary Report
  • Data Analysis Report
  • Sample Submission Report
  • Sample Hold Summary Report

Login to HORIZON today at www.eoilreports.com or contact custserv@eoilreports.com with any questions about electronic sample submission.

Proven Impact. Proven Uptime. Proven Savings.
Let us prove it to you.

Published April 18, 2017

Compliance Yields Results

When equipment replacement costs hit an all-time high, a worldwide oil field service company turned to our team to revitalize their fluid analysis program. Coming from a low rate of compliance with a different fluid analysis firm, the company took a new approach to fluid analysis by adopting our web-based fluid analysis management system, HORIZON®.

Program Impact

Working together, our team designed an effective fluid analysis solution for the oil service company. We assembled a team of qualified experts in customer service, IT and field services to facilitate implementation. Site visits were made to each location, and the company’s employees received training on fluid sampling and use of the HORIZON system. Fluid analysis program champions were identified in the oil service company to provide onsite leadership and keep the program on track.

Results

Eighteen months after implementing its new fluid analysis program, the company’s compliance rate climbed from 40 to 70 percent. The company was able to make better maintenance decisions thanks to the qualified data and recommendations we provided. The oil service company now can plan for most outages, making operations more efficient and improving their bottom line.

To learn how POLARIS Laboratories® can help improve your team’s compliance rate, contact us at custserv@eoilreports.com.

Proven Impact. Proven Uptime. Proven Savings.
Let us prove it to you.

Published April 4, 2017

The 4 Biggest Engine Killers

Diesel engines are one of the most expensive pieces of equipment for a maintenance manager to replace—they are also one of the easiest to save. If oil analysis can save just one engine, you’ve paid for the cost of an effective program, and it will change the way you think about maintenance and reliability.

Making oil analysis part of your predictive maintenance strategy can identify the four biggest engine killers before they cause major problems, saving you thousands of dollars a year in repair and replacement costs. Without a reliable oil analysis program, you may never know when intruders like dirt, soot and coolant threaten your engine oil.

Learn more about the 4 biggest engine killers with this infographic.

Proven Impact. Proven Uptime. Proven Savings.
Let us prove it to you.

Published March 28, 2017

What’s New: Particle Count

POLARIS Laboratories® has shaken up how we perform particle count testing at our U.S. location, and I’m excited about the improvements we’ve seen so far. In order to continue providing customers with top-notch oil analysis service, we switched from using the ISO 11500 test method to ASTM D7647 utilizing a solvent dilution test method.

There is nothing wrong with the equipment performing the ISO 11500 test methods, but we relied on pore blockage testing – an alternative particle count test – for dark samples or water-soluble fluids.

A few years ago, the manufacturer ceased supporting our pore blockage instruments. The effort to maintain the ageing equipment continued to rise, and POLARIS Laboratories® faced the choice of simply replacing the units or consolidating particle count and pore blockage testing into one instrument. We concluded the latter would be better for our internal processes at the same time it improved the service we provide customers.

By setting aside the good to accomplish the great, we knew we would face difficulties that always accompany change. First of all, it meant only the U.S.-based instruments would be replaced, leaving our labs in Edmonton, Guatemala City, and Poznan running ISO 11500 on the current units. While we now have plenty of spare parts for those units, we need to maintain two different test methods until we’re ready to switch over the rest of the locations.

It took about a year to validate the instrument’s capabilities, demonstrate the new method would match or outperform the current process, and organize the laboratories for the change. All of the preparation allows us to be confident we can switch to ASTM D7647 and provide a higher quality test results without a service interruption.

But changing test methods will benefit customers as well. The ISO 11500 test method results sometimes included water and soft, non-damaging particles (such as varnishes and long-chain additives) along with the hard particles that pose a danger to equipment longevity. The solvents we are using in ASTM D7647 allow the results to better represent the particle count of fluid under those conditions. Customers currently receiving pore blockage testing should see a mild shift in particle count results as a result of the new method.

To learn more about the different particle count test methods, the ISO cleanliness code, and how particle count tests results help you extend equipment life, explore our particle count technical bulletins or contact our data analysis team.
Proven Impact. Proven Uptime. Proven Savings.
Let us prove it to you.

Published March 21, 2017
5 Steps for Selecting the Proper Coolant Formulation

There are many different formulations of coolant, most of which aren’t fully compatible. Prevent premature engine failure by learning the right way to maintain your coolant.

Below are five quick steps for selecting the proper coolant formulation. This approach should keep your cooling systems free of coolant cross-contamination.

  1. Determine what the equipment requires. The engine manufacturer and ASTM specifications can be found in the equipment manual or on the company’s website.
  2. See if you are on spec. Make sure your bulk fluid meets the engine manufacturer and ASTM specifications.
  3. Avoid mixing coolants. Using different formulations will dilute the protective inhibitors from each formula and leave the cooling system metal unprotected.
  4. Check the coolant during scheduled maintenance. Check for color change, petroleum contaminants, precipitate, abnormal odors, inhibitors, glycol and pH levels.
  5. Perform laboratory testing. Test coolant quarterly in high-hour, heavy-duty engine applications and twice a year (before summer and winter) in all other applications.

Cooling system problems are responsible for more than 50 percent of unexpected maintenance. Protect your engines with coolant analysis.

Download the coolant solution sheet to learn about protecting your cooling systems and your engines at the same time.

Proven Impact. Proven Uptime. Proven Savings.
Let us prove it to you.

Published March 14, 2017

We’re at ConExpo!

What makes ConExpo different than all other trade shows? Size! With over 2,500,000 square feet of exhibition space, it can be difficult to find your way around. Don’t let that be your excuse for not stopping by the POLARIS Laboratories® booth!

To help you find your way, visit our ConExpo page. There, you’ll find a map of Bronze Hall that’ll lead you straight to Booth B92713.

Our team has put together a number of true stories that we look forward to sharing with you. Make sure you take a moment to ask our team how they:

  • Saved a major equipment dealer $75K on a brand new transmission
  • Decreased a Fortune 500 company’s cost of repairs by 40%
  • Helped a leading coal company decrease its critical fluid analysis reports by 15%

We look forward to addressing these and any other questions you may have! For those of you not attending, contact us at getstarted@polarislabs.com to stay connected.

Proven Impact. Proven Uptime. Proven Savings.
Let us prove it to you.

Published March 8, 2017