Smarter Fluid Analysis Starts Here
Is your fluid analysis program truly delivering accurate, actionable insights or are manual processes and incomplete data holding you back? If so, it might be time to rethink your fluid analysis program.
Many maintenance teams still rely on handwritten forms, disconnected systems, and inconsistent data entry. These outdated workflows don’t just slow things down—they introduce errors, reduce visibility, and limit the value of your fluid analysis program. The result? Missed insights, delayed decisions, and preventable downtime.
Predictive maintenance demands a smarter approach to how you utilize fluid analysis.
Start with a Strong Data Foundation
Accurate equipment and component data is the backbone of any effective fluid analysis program. Without it, even the most advanced diagnostics can fall short. Standardizing and maintaining clean, consistent data ensures every sample is tied to the right asset—improving reliability and confidence in results.
Eliminate Manual Errors with Digital Workflows
Handwritten sample forms are prone to mistakes and delays. Moving to digital sample registration helps eliminate misinterpreted data errors, ensures required fields are completed, and speeds up the entire submission process. Better data from the start leads to better analysis and clear maintenance actions.
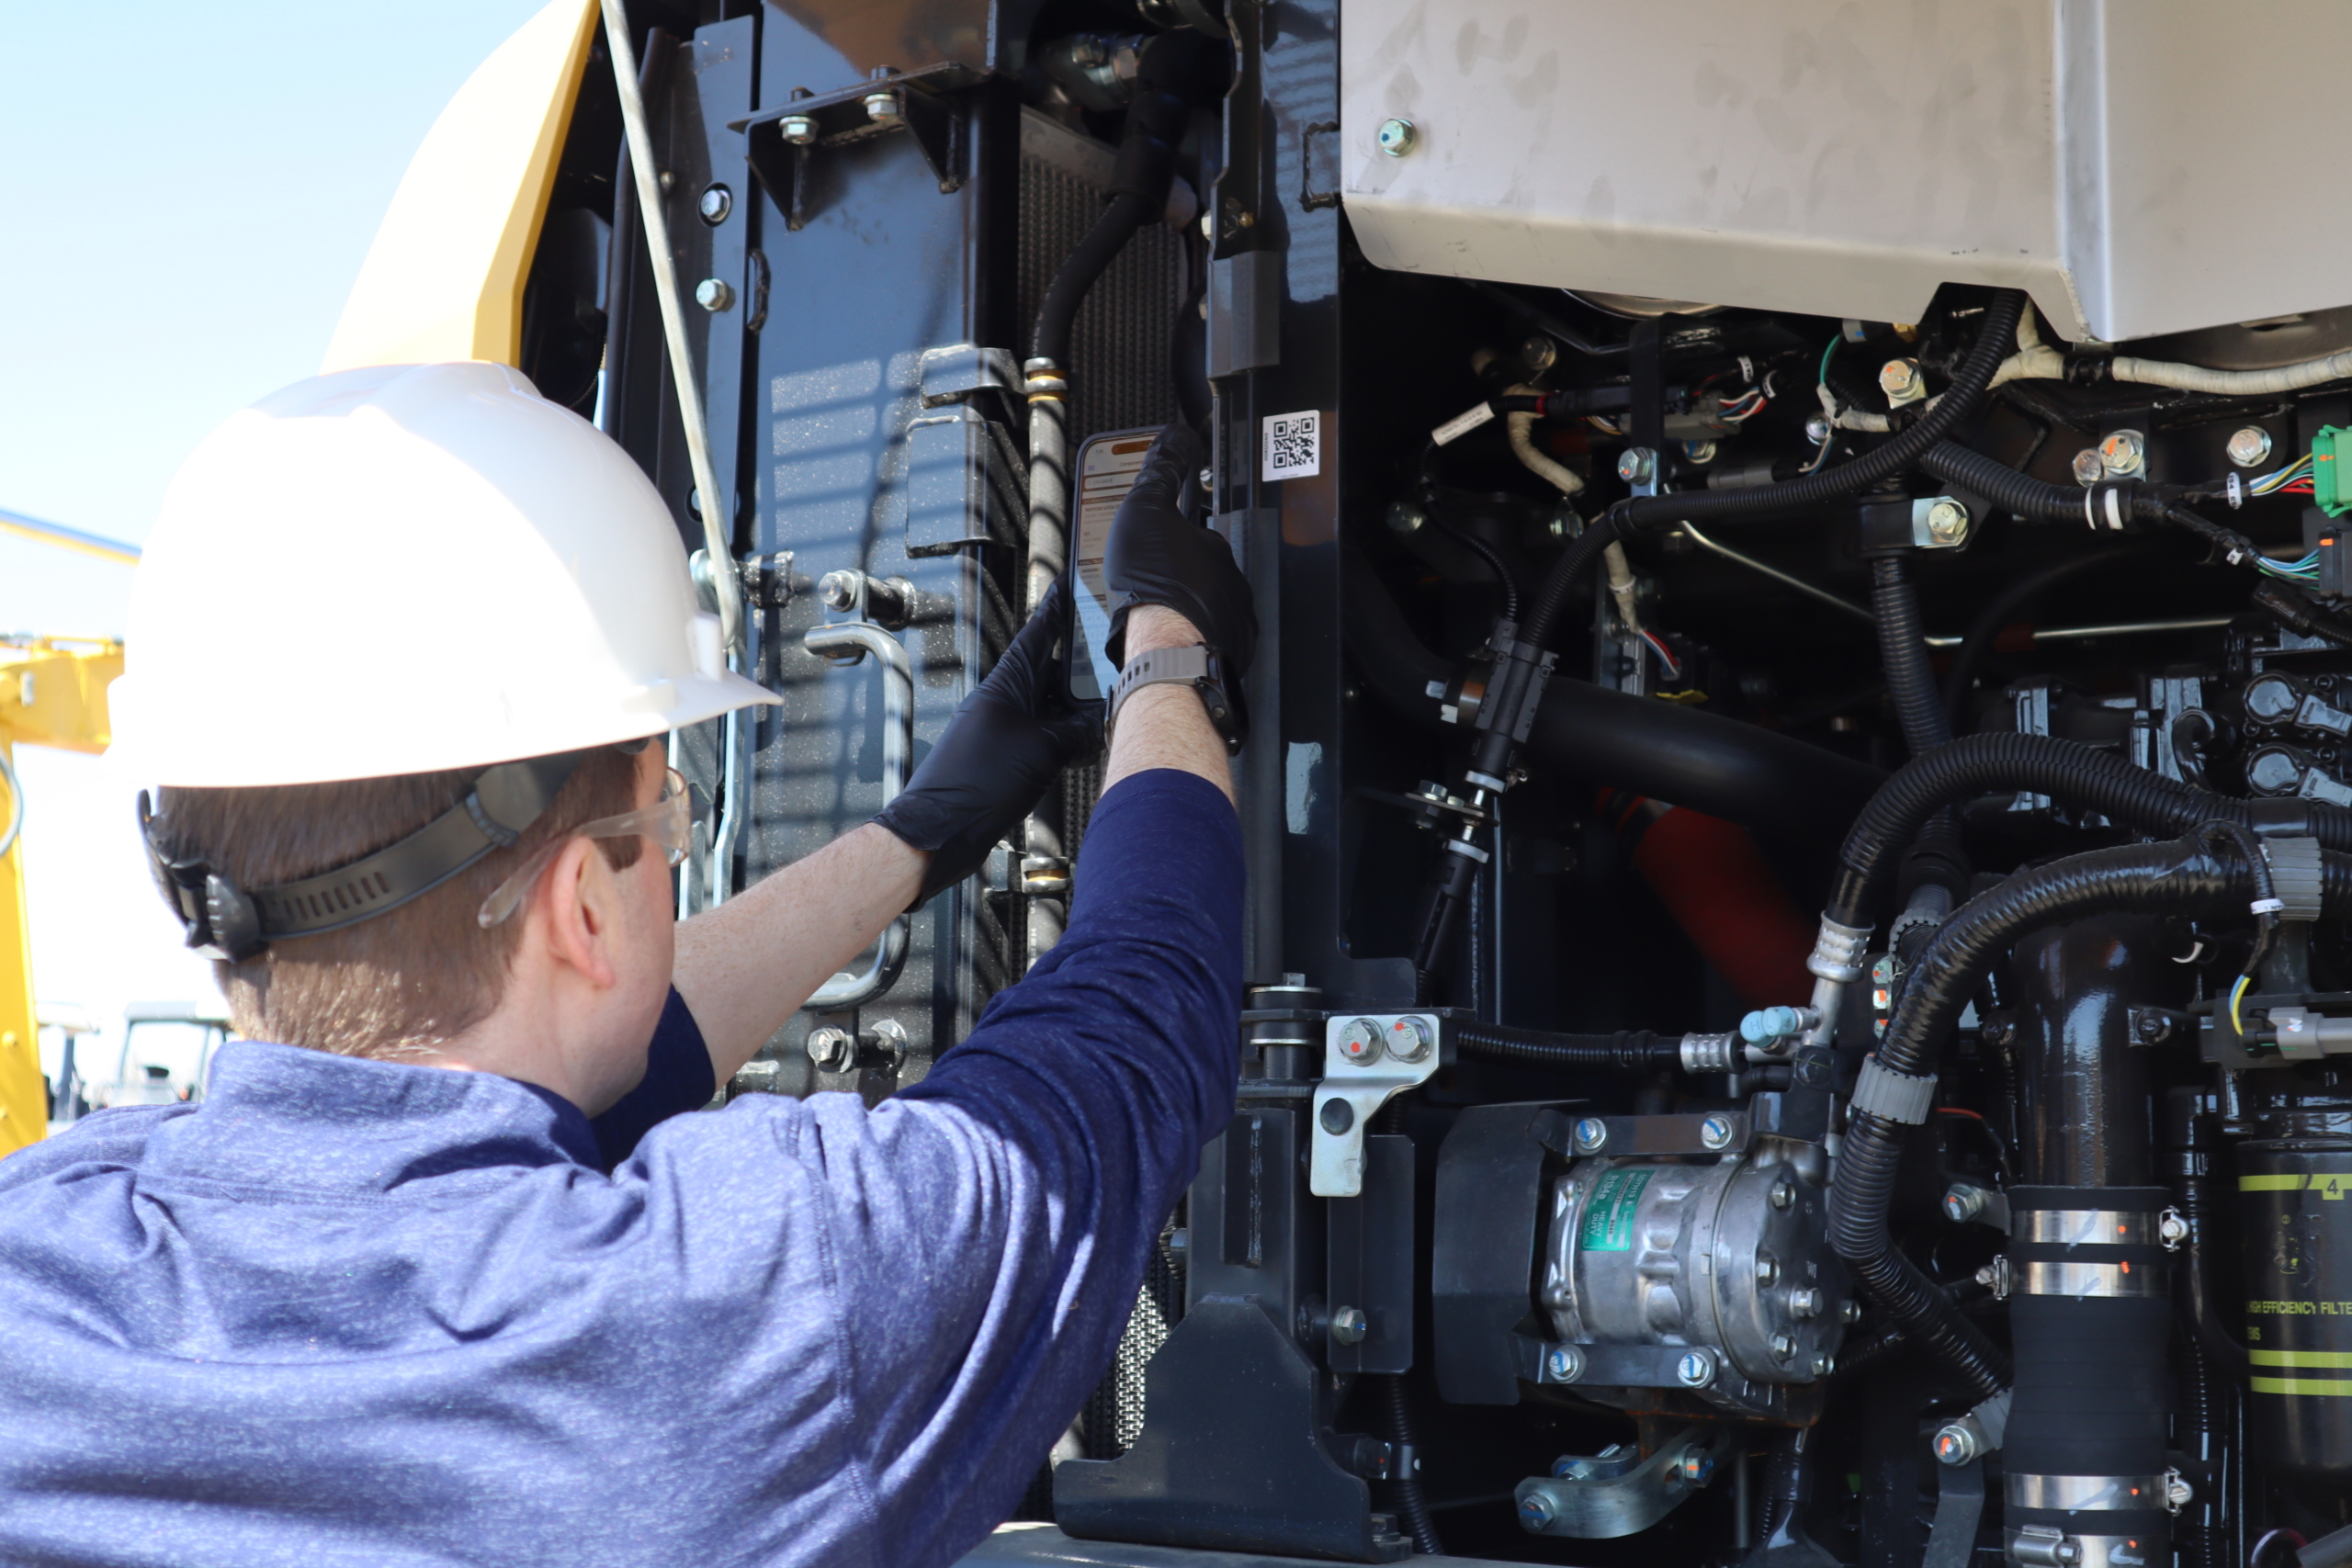
Streamline Sampling in the Field
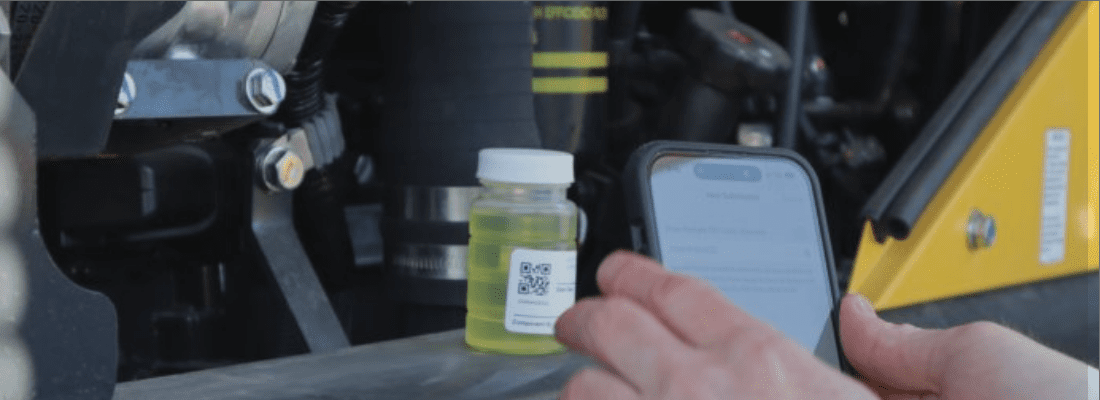
Mobile tools allow technicians to register samples, access asset information, and submit sample information in real time—right from the field. This not only improves efficiency but also ensures data is captured accurately at the source.
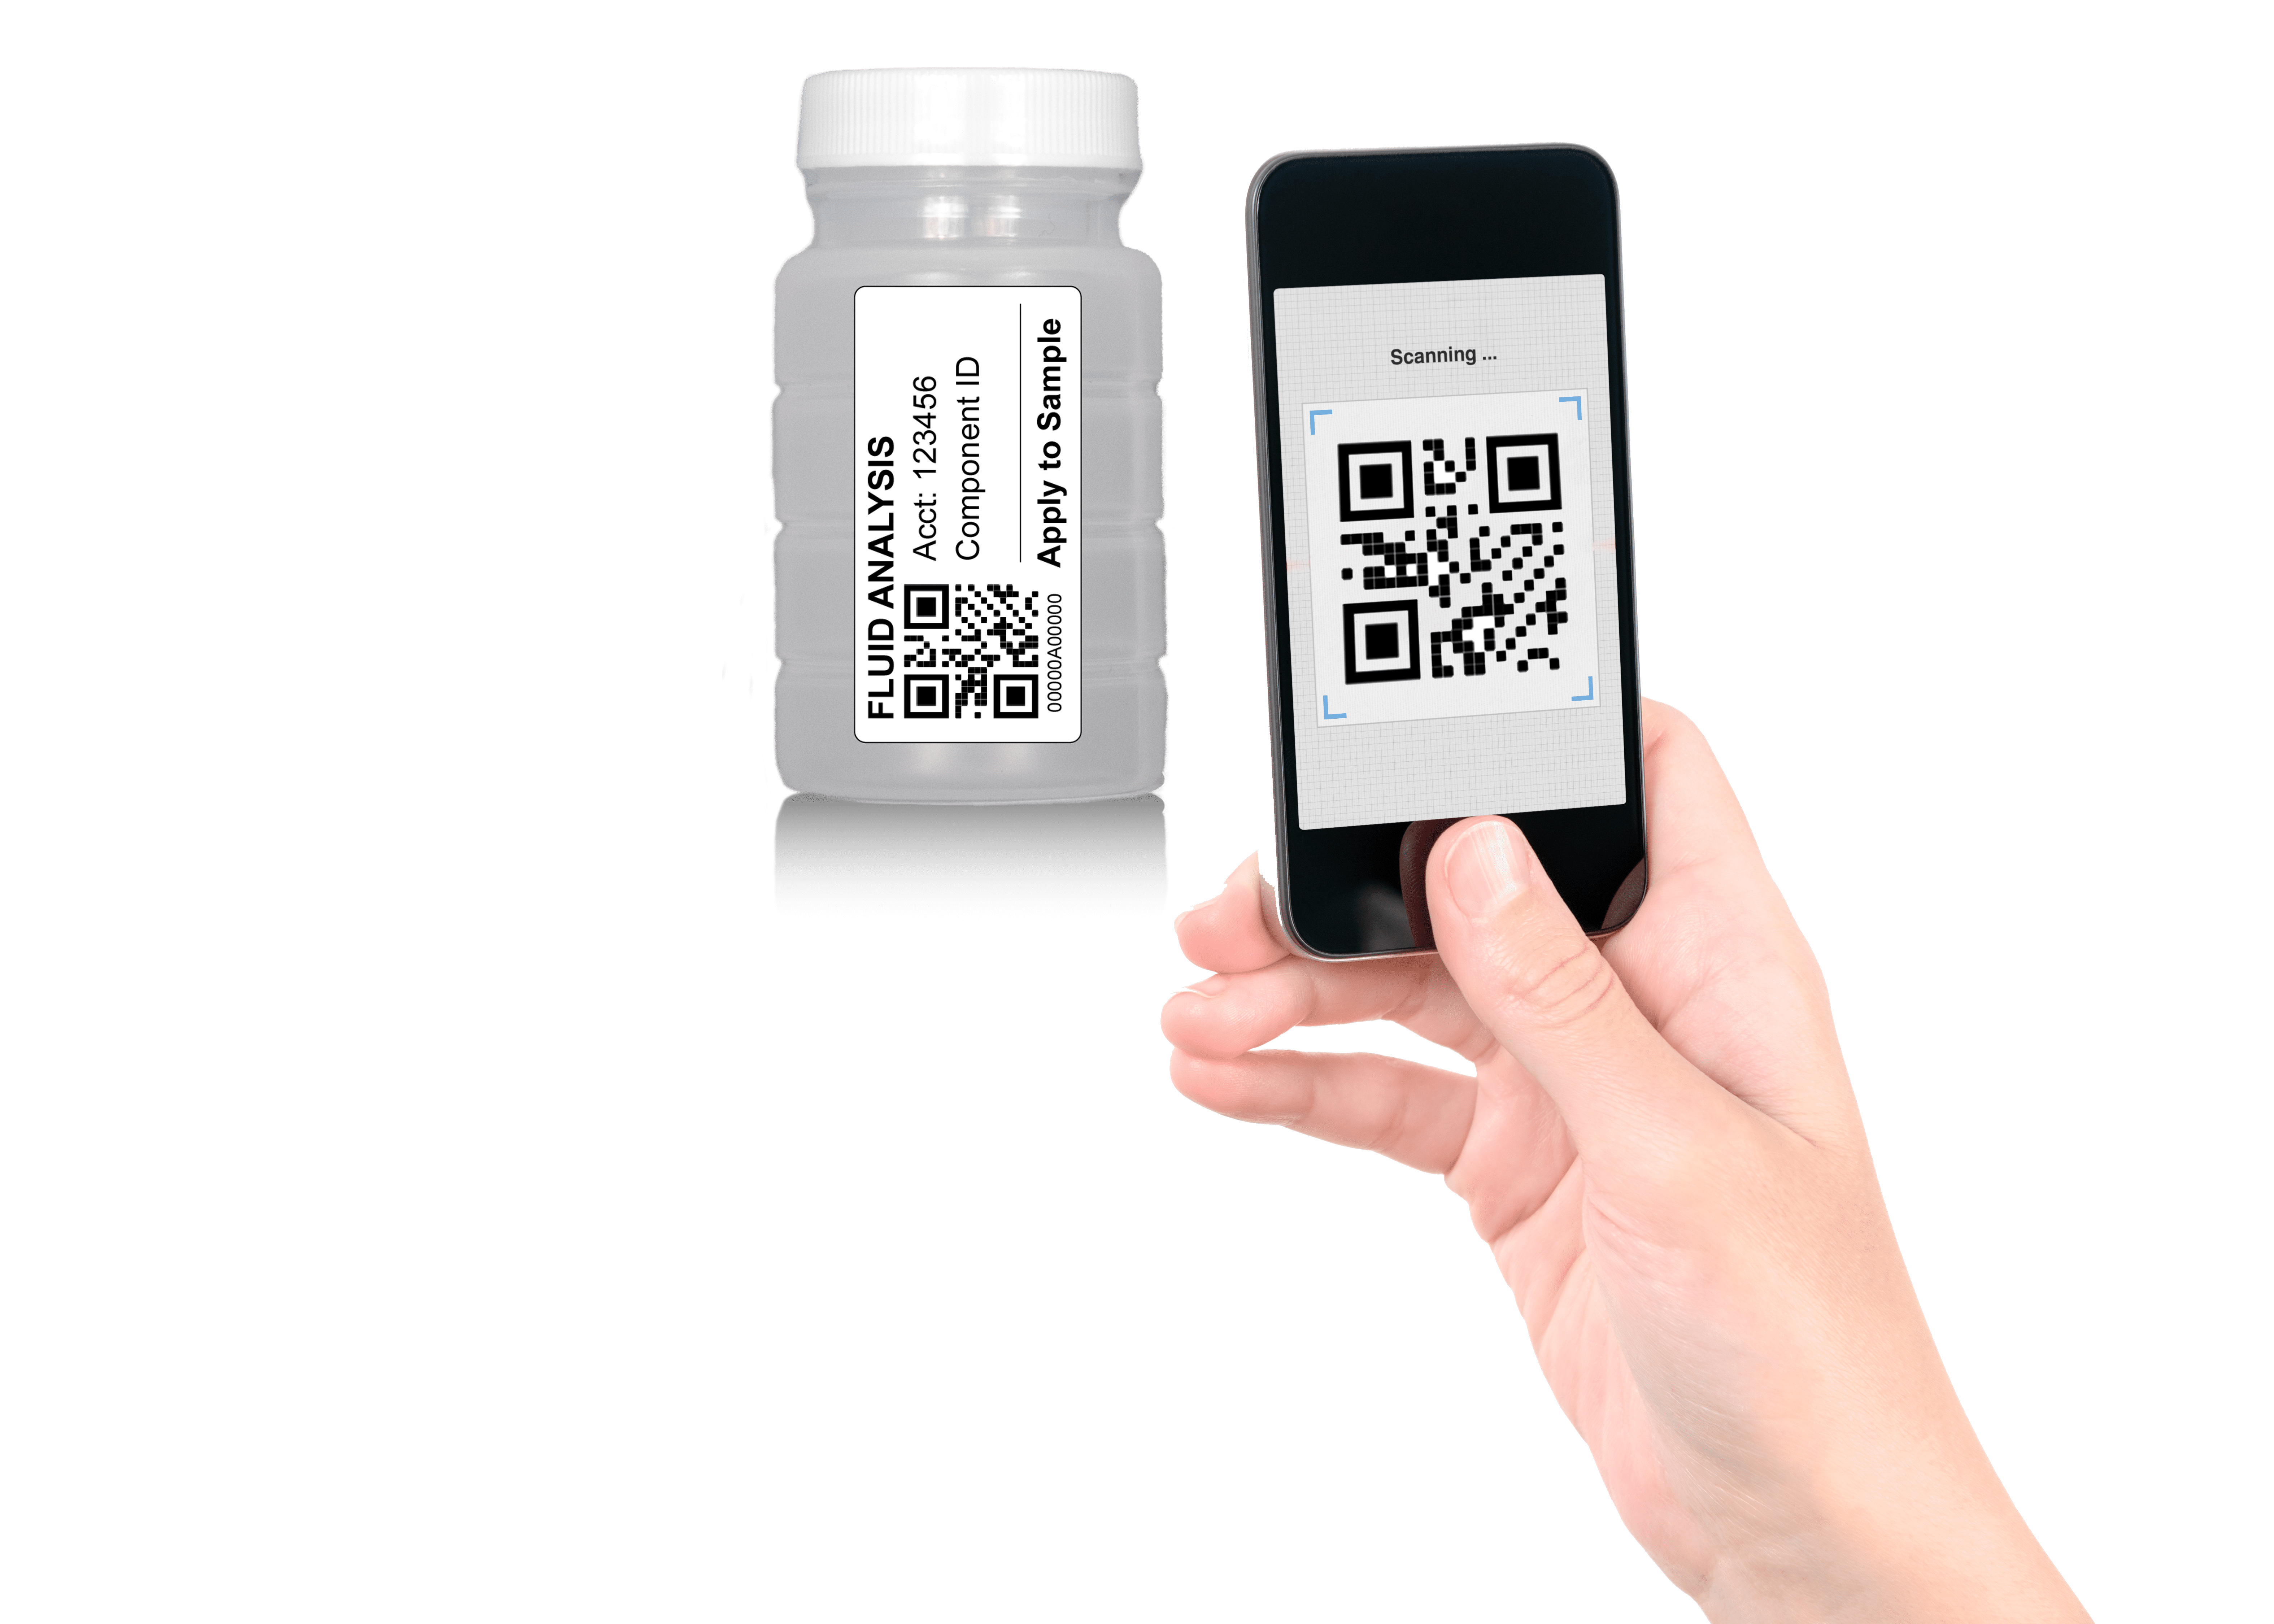
Use QR Codes for Speed and Accuracy
QR codes simplify sample registration and component identification, removing guesswork and standardizing the process. A quick scan links the sample directly to the correct asset in HORIZON, reducing errors and saving valuable time.
Learn More About How to Go Digital
Connect Your Systems
Fluid analysis shouldn’t live in a silo. Integrating data with your CMMS or EAM system creates a more complete view of equipment health, enabling faster, more informed maintenance decisions for condition-based maintenance. Learn more about POLARIS Laboratories’ secure, seamless API HORIZON Connect.
Improve Data to Unlock Better Insights
High-quality, complete data is essential for advanced insights and diagnostics—including POLARIS Laboratories’ AI-driven analysis engine, Aurora. The more accurate and consistent your data, the more powerful and smarter your insights become.
Turn Insight into Action
When your fluid analysis program is connected, standardized, and digital, it becomes more than a reporting tool—it becomes a driver of reliability. Teams can prioritize maintenance more effectively, reduce unplanned downtime, and improve overall program ROI.
It’s time to rethink fluid analysis and learn how to predict maintenance with fluid analysis. Join our upcoming webinar and learn practical steps you can take today:

WEBINAR
Smarter Fluid Analysis: A Checklist for Reliability
May 14, 11 a.m. ET
REGISTER HERE
Smarter fluid analysis isn’t just about testing—it’s about transforming how data is captured, connected, and used.
Published May 4, 2026


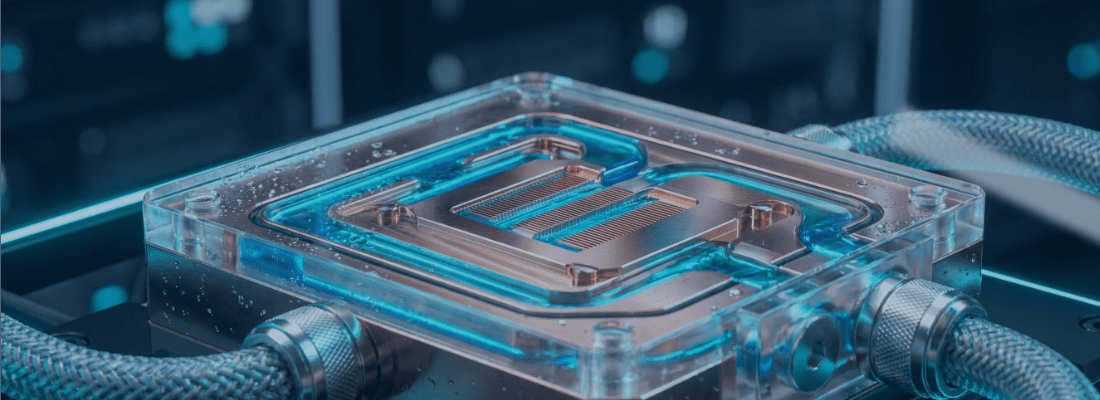 As data centers evolve to support AI, high‑performance computing (HPC), and higher power densities, traditional air cooling alone is often no longer sufficient. This shift in cooling technologies is driving increased adoption of Direct‑to‑Chip (D2C or DTC) liquid cooling, particularly in high‑heat, high‑density environments.