Salesforce is a leading cloud-based CRM platform that helps businesses manage customer relationships and sales processes.
visitor_id8822-hash
Salesforce Pardot (Account Engagement) hash cookie used to validate the visitor ID for tracking and marketing automation.
1 year
visitor_id8822
Salesforce Pardot (Account Engagement) tracking cookie used to identify website visitors, track page views, and support marketing automation and lead scoring.
10 years
pctrk
Used to count page views by unauthenticated users against license usage.
session
clientSrc
Used to validate the IP from where a user logs in.
session
_KnowledgePageSortFieldArticle
In Salesforce Classic, used to remember the last user selection for Sort by for the Articles view in Knowledge.
session
renderCtx
Used to deliver requested pages and content based on a user's navigation.
session
oinfo
Used to track the State, Edition and orgID of a customer's org.
3 months
_KnowledgePageSortFieldMyDraft
In Salesforce Classic, used to remember the last user selection for Sort by for the My Drafts view in Knowledge.
session
expid_
Used to render pages based on specified brand.
session
_spring_KmMlAnyoneDraftArticlesList
In Salesforce Classic, used to configure layout properties for the Draft Articles view in Article Management.
1 day
force-stream
Used to properly route server requests within Salesforce infrastructure for sticky sessions.
3 hours
oid
Used to redirect a user to the correct Salesforce org and assist the user for the next login.
2 years
sfdc-stream
Used to properly route server requests within Salesforce infrastructure for sticky sessions.
3 hours
CookieConsentPolicy
Used to apply end-user cookie consent preferences set by our client-side utility.
1 year
_KMPage
In Salesforce Classic, used to read the last user selection for Find in View, Article Language, {DataCategory}, and Validation Status in Article Management.
1 day
_KnowledgePageDispatcher
In Salesforce Classic, used to remember the user selection to determine whether to show Articles or My Drafts view in Knowledge.
session
_spring_KmMlArchivedArticlesList
In Salesforce Classic, used to configure layout properties for Archived Articles in Article Management.
1 day
_KnowledgePageFilter
In Salesforce Classic, used to remember the last user selection for the data category filter in Knowledge.
session
_KnowledgePageFilterArticleArticleType
In Salesforce Classic, used to remember the last user selection for the article type filter for Articles view in Knowledge.
session
_KnowledgePageFilterArticlePublishStatus
In Salesforce Classic, used to remember the last user selection for the publish status filter for Articles view in Knowledge.
session
_KnowledgePageFilterArticleValidationStatus
In Salesforce Classic, used to remember the last user selection for the validation status filter for Articles view in Knowledge.
session
_KnowledgePageFilterLanguage
In Salesforce Classic, used to remember the last user selection for the language filter in Knowledge.
session
apex__EmailAddress
Caches contact IDs associated with email addresses.
1 year
idccsrf
Used for SSO authentication as CSRF protection.
3 months
activeView
In Salesforce Classic, used to remember the last user selection for Articles or Translations tab in Article Management.
session
sid_Client
Used to validate orgid and userid on the client side.
session
_sid
Identifies a Live Agent session. Stores a unique pseudonymous ID for a specific browser session over chat service.
session
QCQQ
Used to detect the official login page for Forced Login POST detection.
session
_spring_KmMlPublishedTranslationsList
In Salesforce Classic, used to configure layout properties for Published Translations in Article Management.
1 day
BrowserId
Used to log browser sessions/visits for internal-only product analytics.
1 year
_spring_KmMlPublishedArticlesList
In Salesforce Classic, used to configure layout properties for Published Articles in Article Management.
1 day
force-proxy-stream
Used to ensure client requests hit the same proxy hosts and are more likely to retrieve content from cache.
3 hours
_spring_KmMlMyDraftTranslationsList
In Salesforce Classic, used to configure layout properties for Draft Translations in Article Management.
1 day
BrowserId_sec
Used to log secure browser sessions/visits for internal-only product analytics.
1 year
_kuid_
Registers a unique ID that identifies a returning user's device. The ID is used for targeted ads.
6 months
rsid
Used for an admin user to 'log in as' one of their org user.
session
auraBrokenDefGraph
Used to track when a Lightning page has malformed HTML.
1 week
rsid2
Used for an admin user to 'log in as' one of their org portal user.
session
autocomplete
Determines if the login page remembers the user’s username.
60 days
RRetURL
Used for 'log in as' to return to original page.
session
_KnowledgePageFilterMyDraftArticleType
In Salesforce Classic, used to remember the last user selection for the article type filter for My Drafts view in Knowledge.
session
BAYEAX_BROWSER
Identify a unique browser subscribed to CometD streaming channels.
session
RRetURL2
Used for portal 'log in as' to return to original page.
session
_KnowledgePageFilterMyDraftPublishStatus
In Salesforce Classic, used to remember the last user selection for the publish status filter for My Drafts view in Knowledge.
session
calViewState
Sets the inline calendar date state in Salesforce Classic (current week selected).
session
alohaEpt
Used to log page load EPT (Experience Page Time) for Visualforce (Classic UI) pages.
90 sec
_KnowledgePageFilterMyDraftValidationStatus
In Salesforce Classic, used to remember the last user selection for the validation status filter for My Drafts view in Knowledge.
session
caPanelState
Saves the open, closed, and height percent states of the calendar panel.
session
_spring_KmMlMyDraftArticlesList
In Salesforce Classic, used to configure layout properties for Draft Articles assigned to Me in Article Management.
1 day
csssid_Client
Enables user switching.
session
devOverrideCsrfToken
CSRF Token.
session
disco
Tracks the last user login and active session for bypassing login. For example, OAuth immediate flow.
session
FedAuth
For the SharePoint connector, used to authenticate to the top-level site in SharePoint.
session
gTalkCollapsed
Controls whether the sidebar in Salesforce Classic is open for a user.
1 year
guest_uuid_essential_
Provides a unique ID for guest users in Salesforce Sites. Expires 1 year after the user’s last visit to the site.
1 year
hideDevelopmentTools
Used to determine whether to show the developer tools.
session
hideFilesWarningModal
Stores the user acknowledgment that a public link to a Salesforce file is on email send. The warning window isn’t continually shown after the user acknowledges this action.
50 years
hideIdentityDialog
Hides the dialog box that informs that the current user is logged out when switching to another user.
1 year
Host-ERIC_PROD-
Enterprise Request Infrastructure Cookie (ERIC) carries the cross-site request forgery (CSRF) security token between the server and the client. The cookie name indicates the server mode (PROD or PRODDEBUG) and a random number. A different token is generated for each Lightning app.
1 minute
PreferredLanguage
Stores the user language preference for language detection and localized user experience.
1 year
sfdc_lv2
Stores identity confirmation details for users. If the cookie isn’t set or it expires, users must repeat the identity confirmation process the next time that they log in. Identity confirmation requires a verification method such as SMS, an authenticator app, or a security key.
1 year
WelcomePanel
Stores Salesforce preferences.
1 day
pc-unit
Sets a preference for displaying platform cache units to either MB or KB.
1 year
webact
Used to collect metrics per page view for personalization.
1 year
login
If the user’s session has expired, used to fetch the username and populate it on the main login page when using the process builder app.
60 Days
waveUserPrefFinderListView
Preference for displaying list views in CRM Analytics.
100 years
lloopch_loid
Determines whether to send the user to a specific portal login or an app login.
1 year
waveUserPrefFinderLeftNav
Preference for left navigation UI in CRM Analytics.
100 years
liveagent_sid
Identifies a Live Agent session. Stores a unique pseudonymous ID for a specific browser session over chat service.
session
useStandbyUrl
Controls how quickly to set the standby URL when loading the softphone.
session
t
Used to avoid duplicate access checks.
session
SUPRM
Used when the user identity that an administrator is assuming, via Log In as Another User, is a Partner Relationship Management (PRM) portal user.
session
SUCSP
Used when the user identity that an administrator is assuming, via Log In as Another User, is a Customer Success Portal (CSP) user.
session
ssostartpage
Identifies the Identity Provider (IdP) location for single sign-on (SSO). Certain service provider initiated SSO requests can fail without this cookie.
1 year
SetupDomainProbePassed
Indicates whether the web client successfully accessed the new *.salesforce-setup.com domain. If the cookie value is true, then Setup pages are served from *.salesforce-setup.com. If false, Setup pages are served from *.force.com. In this case, users are sometimes required to view Setup pages in Salesforce Classic instead of in Lightning Experience.
Session
__Host-ERIC_PROD-
Enterprise Request Infrastructure Cookie (ERIC) carries the cross-site request forgery (CSRF) security token between the server and the client. The cookie name indicates the server mode (PROD or PRODDEBUG) and a random number. A different token is generated for each Lightning app.
Session
redirectionWarning
Enables the customer to store URLs that are exempt from setting a redirect warning interstitial page on an allowlist.
1 year
csssid
Used to establish a request context in the correct tenant org.
session
liveagent_invite_rejected_
Instructs Live Agent not to reissue an invitation on the same domain. Deletion of this cookie degrades the customer’s experience because they can get repeated invitations.
session
cqcid
Used to track a guest shopper’s browsing activity.
1 year
lastlist
Used to store the cookie name for the last list URL.
session
cordovaVersion
Used for internal diagnostics with mobile applications.
session
iotcontextsplashdisable
For the IoT product, stores user preference of whether to show Context Splash popup.
10 years
cookieSettingVerified
Used to create a popup message telling users that cookies are required.
session
inst
Used to redirect requests to an instance when bookmarks and hardcoded URLs send requests to a different instance. This type of redirect can happen after an org migration, a split, or after any URL update.
session
visitor_id
The visitor cookie includes a unique visitor ID and the unique identifier for your account.
1 year
ideaToggle
Show the Ideas list view or the Feed list view.
session
sidebarPinned
Controls the state of the Salesforce Classic sidebar.
10 years
showNewBuilderWarningMessage
Used to show or hide a warning message for the new dashboard builder.
100 years
schgtclose
Deprecated feature, not used.
session
promptTestMod
Stores whether test mode is in effect. This cookie is read-only.
30 days


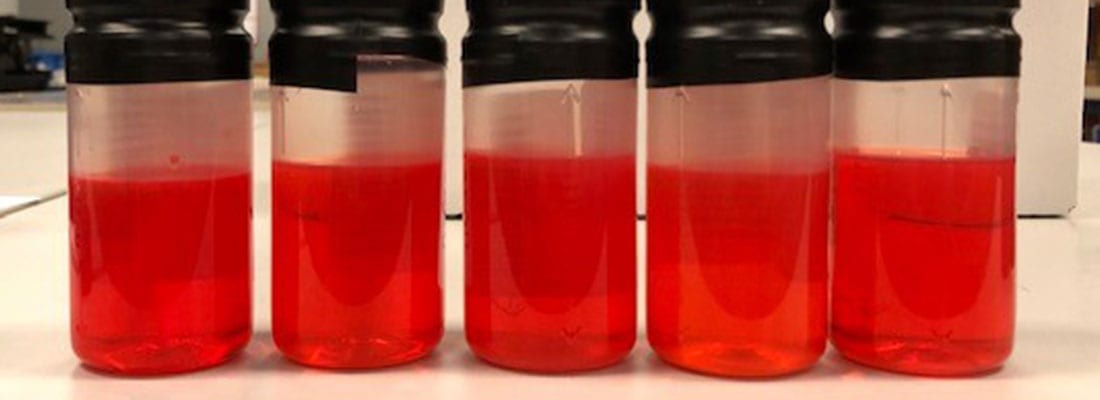
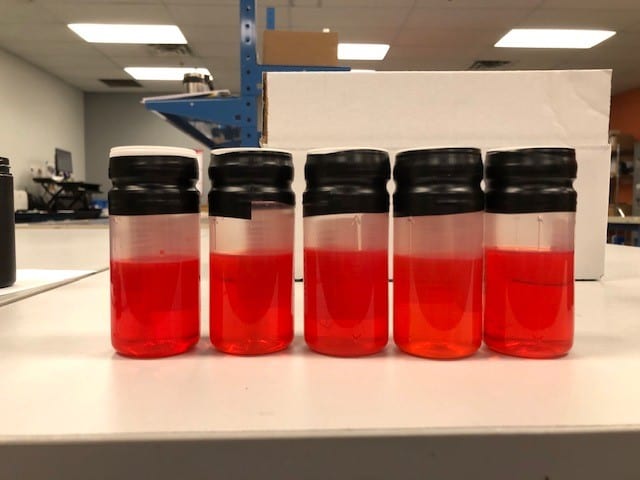
 Background on Base Number Testing


 You’ve made the decision to use POLARIS Laboratories® as your trusted fluid analysis provider, a great start to a successful fluid analysis program. Now are using all the features available? POLARIS Laboratories® provides more than fluid analysis. Learn about how our convenient mobile app can help you manage your program in real time.