ISO/IEC 17025: What Does it Mean to You?

In this day and age there are many internationally recognized quality standards. One of the most common is ISO 9001, used predominantly in the production industries. This standard primarily addresses management, corrective and preventive polices and procurement. I’m sure you’ve heard of ISO/IEC 17025 in relation to laboratory quality standards and accreditation. These requirements were developed from the ISO 9001 – with a specific focus on laboratory functions.

What is ISO/IEC 17025?

ISO/IEC 17025 specifies requirements for the competency of the entity to carry out tests and/or calibrations, including sampling. It covers testing and calibration performed using standard methods, non-standard methods and laboratory-developed methods. It ensures accredited laboratories are able to demonstrate that they are technically proficient and that the data produced is both accurate and precise. While it is a voluntary requirement, the accreditation requirements are reviewed by third-parties to ensure that the laboratory’s quality management system is thoroughly evaluated to guarantee continued technical competency and compliance with ISO/IEC 17025.

Laboratory accreditation bodies use the ISO 17025 standard specifically to assess factors relevant to a laboratory’s ability to produce precise, accurate test and calibration data. This includes:

  • Traceability of measurements and calibrations to both national and international standards
  • Technical competence of laboratory staff
  • Test equipment maintenance
  • Quality assurance of test and calibration data
  • Validity and appropriateness of test methods
  • Appropriate handling and transportation of test items

Accreditation bodies regularly re-assess laboratories that are under the ISO/IEC 17025 for continued compliance to the standard. Furthermore, laboratories are required to participate in regular proficiency testing programs, to demonstrate their ongoing competence to perform the testing.

So, what does all of this mean to you, the customer?

Whether you are a current customer or are looking to begin fluid analysis testing with a laboratory, selecting an ISO/IEC-accredited laboratory helps you:

  • Minimize risk – an important component of the ISO 9001 quality standard.
  • Ensure you are choosing a technically-competent laboratory.
  • Gain peace of mind that the laboratory a has sound, proficient quality system in place.
  • Be confident the laboratory has had its systems and processes evaluated by an independent third party.

As an ISO/IEC 17025-accredited laboratory, POLARIS Laboratories® demonstrates a proven track record of having a robust and effective quality system to ensure that you, the customer, can expect accurate and reliable sample data and technically-sound maintenance recommendations. Learn more about POLARIS Laboratories’ commitment to quality performance and our ISO/IEC 17025 accreditation.

Proven Impact. Proven Uptime. Proven Savings.
Let us prove it to you.

Published June 4, 2018

Creating Customer Value with Lean

As a leading fluid analysis laboratory – we strive to meet our customers needs and exceed their expectations. Our fluid analysis laboratories operate under Lean principles – maximizing customer value while minimizing waste. Simply put, this means we create more value using fewer resources. The Lean ideas, principles and standards were originally created by Toyota to eliminate waste and inefficiency in its manufacturing operations. The process became so successful that it has been embraced in manufacturing sectors around the world – POLARIS Laboratories® included. We fully embrace and operate under Lean principles in all six of our laboratory locations.

So, how do we ensure our laboratory is operating efficiently and effectively through these principles? Some of the practices, standards and initiatives we have implemented to support a Lean laboratory environment are below.

Efficient work flow, standard work and performance management:

  • No walls or separation of testing areas – this promotes flexible operations and the sharing of workloads and resources.
  • Visualization of workloads at each test station.
  • Workplace design – this allows the combination of tests to create balanced, productive technician workloads and standard work while reducing waste of motion and energy.
  • Visual management of laboratory performance (for example, TV monitors display current work performance and performance over time. These metrics are monitored and reviewed daily).

Effective use of staff time and minimizing waste of motion:

  • Adjacent and accessible conference and huddle rooms that encourage collaboration.
  • Areas dedicated specifically to write-ups, reviews and approvals provides timely documentation.
  • Laboratory test stations are in close proximity to sample processing, ensuring a quick transfer of samples from receipt to testing stations.
  • Central location of parts and consumables near test stations.

Maximize future configurability:

  • The building’s HVAC and electrical systems are set up in a grid system – allowing stations to be moved easily if necessary.
  • Test stations equipped with wheels allow for quick and easy reconfiguration.

Lean behaviors and communication:

  • Glass walls between support staff and operation staff offers an open-office feel.
  • Laboratories are equipped with Process Improvement Boards throughout.

Support workplace organization and “5S”:

5S goes hand-in-hand with Lean principles (Sort, Set in Order, Shine, Standardize, Sustain) and improves workplace efficiency and eliminates waste.

  • All laboratory workstations are identified with labels for designated supplies.
  • Easily identifiable color-coded sample trays provide effective sample management, processing and testing.
  • Workstations equipped with 5S checklist – which is reviewed and approved daily.
  • Designated storage and organization throughout the laboratory.

By ensuring our laboratory facilities, staff and testing stations align with Lean principles, we continue to provide maximum value to our customers – saving time and money – and more of their equipment.

Proven Impact. Proven Uptime. Proven Savings.
Let us prove it to you.

Published May 29, 2018

3 Ways to Achieve Program Success

Oil analysis will not and should not replace good, everyday maintenance practices. If used properly, oil analysis becomes a valuable diagnostic tool that can reduce maintenance costs, increase productivity and boost company profits. When used in conjunction with diagnostic tools such as vibration analysis, ultra sound and thermography, oil analysis can detect a variety of problems before they become failures. This gives users the valuable time necessary to make decisive, well-informed maintenance decisions. But often times, this is easier said than done. I’ve outlined a few ways to help your program be successful and reach its full potential:

  1. Set Realistic Goals

    • Set productive, attainable goals by which you can measure the success of your program and examine your current maintenance program.
      • What is your maintenance strategy and what, if anything, does it accomplish?
      • How do you measure that accomplishment?
    • Do you want to:
      • Monitor the condition of the lubricant?
      • Monitor the condition of the equipment?
      • Monitor the condition of the lubricant and the equipment?
      • Monitor system cleanliness?
      • Monitor contamination and wear?
      • Adopt a proactive maintenance strategy vs. a reactive one?
      • Extend oil drain intervals?
      • Reduce downtime?
      • Prevent/reduce failures?
      • Extend equipment life expectancy?
  2. Set Realistic Expectations

    • What would it mean to your company financially to reduce downtime by 20%? Extend drain intervals by 25%? Reduce failures by 15%? Increase equipment life by 10%? How much money could be saved by becoming proactive as opposed to reactive? Affect change in your everyday maintenance practices by performing minor maintenance as often as necessary to avoid failure and ALWAYS act immediately on critical samples.
  3. Measure Your ROI

    • Measuring the effectiveness of your oil analysis program can easily justify its cost, or ROI, to management. To do this: determine your savings in increased uptime, reductions in oil consumption, labor parts replacement and compare that to the cost of doing oil analysis. Seeing these savings can help determine if your program is successful.

Setting both realistic goals and expectations and then measuring your return on investment can help you determine if your program is maximized and functioning as it should, and allows you to re-evaluate those goals if necessary.

Proven Impact. Proven Uptime. Proven Savings.
Let us prove it to you.

Published May 22, 2018

Is Your Program Losing Momentum?

Maintaining a successful program comes with challenges

Maintenance teams jump over countless hurdles and experience numerous challenges while building an efficient predictive maintenance program. These hurdles and challenges can result in the maintenance program slowly losing it’s momentum. Below, I’ve outlined some common reasons we see that could explain why maintenance programs may not live up to their potential and be maximized fully:

  • Budget | maintenance program is the first budget to get reduced
  • Leadership Changes | executive management changes can result in new overall maintenance goals
  • Loss of Value| the company may no longer see value in their predictive maintenance program

At POLARIS Laboratories®, we strive to establish, achieve and maintain rapport with our customers and who we call Program Champions. These Program Champions are true believers in the benefits, cost savings and increasing equipment reliability resulting from an effective fluid analysis program. As an Account Manager, I see the above reasons and changes occur more frequently than you would expect. Often times, when maintenance programs lose their momentum and begin to dwindle, the entire process for establishing a Program Champion and a routine, effective fluid analysis program starts over. Although this provides a struggle for us as a partner you as a customer – we see this as an opportunity to educate the maintenance team and executive level leadership on the importance of a successful predictive maintenance program while incorporating fluid analysis.

What do you do if your predictive maintenance program loses its momentum?

There are companies that provide solutions and services – whether it be a consulting firm or equipment manufacturer – for improving maintenance programs but ultimately, the customer is responsible for implementing the solutions and maintaining them.

Below are some practical ways to keep your predictive maintenance program from losing momentum – by utilizing existing resources.

  1. Establish a Program Champion who sees the value in improving equipment reliability who can train the maintenance team to maximize and execute the program.
  2. Keep in constant communication with the fluid analysis and other service providers.
  3. Partner with a reliable, accredited fluid analysis laboratory who can help the end user monitor their equipment’s condition before it becomes critical.

Overall, it’s important to overcome these hurdles and maintain your maintenance program, it could save you both time and money in the end. And, let’s face it – can your equipment afford not to?

Proven Impact. Proven Uptime. Proven Savings.
Let us prove it to you.

Published May 8, 2018

From the Expert: Effects of Varnish

Varnish is a gel-like substance that adheres to metal surfaces and can cause hot spots, increase in machine temperature and can result in filter plugging, micro-dieseling and can cause catastrophic failure. It’s important to test for varnish on turbines, compressors, hydraulics and large circulation and lube systems. We’ve turned to our expert, CLS and OMA I certified Data Analyst, Elaine Hepley, to explore varnish and the Membrane Patch Colorimetry (MPC) test conducted to detect it as well as two other tests that can help identify varnish formation potential.

  • Membrane Patch Colorimetry (MPC) ASTM D7843
    • MPC is a test designed to capture any presence of varnish that is soluble with the oil. This test is performed by heating the sample to 60 to 65 degrees Celsius for 23 to 25 hours. The sample is then placed in the dark away from UV light for 68 to 76 hours. After the incubation period, the sample is mixed with Petroleum Ether and stirred for 30 seconds to allow a complete mixture and then filtered onto a 47mm, 0.45-micron-size membrane patch.
    • The patch is placed in a location free of dust and heat and air-dried for about 3 hours. Once the patch has been dried, a colorimeter is used to detect the color of the patch and the CIE Lab ΔΕ and L*a*b* calculations are used to report the color of the patch. The color and severity scale is as follows:
      • 0-14.99: Severity 0 – Very low potential for varnish formation
      • 15-19.99: Severity 1 – Minor potential for varnish formation
      • 20-29.99: Severity 2 – Moderate potential for varnish formation
      • 30-39.99: Severity 3 – Significant potential for varnish formation. Preventative measures should be taken to stop the continuous formation of varnish
      • >40: Severity 4 – Severe and evident formation of varnish in system, and action must be taken to remove varnish.
    • The lighter (whiter) the color of the patch, the lower the MPC value and the darker (amber) color of the patch, the higher the MPC value.
    • PLEASE NOTE: Gray discoloration of the patch can be attributed to micro-dieseling or static discharge in the filters.
    • MPC testing can be performed on turbines and other unit types such as compressors, hydraulics, large circulation and lube systems.
  • Linear Sweep Voltammetry (LSV) ASTM D6971
    • LSV uses a voltage reading to detect the presence of anti-oxidants amines and phenols. The test is performed using an alcohol/acetone based solution (yellow or green) to help draw out the anti-oxidants from the oil. An electrical current is introduced to the sample and reveals the presence of amines and phenols in a matter of seconds. The results of the used oil are compared to a standard (new lubricant levels) and the differences/changes in the anti-oxidants in percentage are reported.
    • Some formulations are composed of amine, phenols or both. Phenols are considered to be the “sacrificial anti-oxidant” when formulated in conjunction with amines. The role that the phenols have is to be the first to deplete. This leaves behind amines to stabilize and keep the potential for varnish at bay.
    • That is not to say that phenols are a weak anti-oxidant. In a phenol-only formulation, the phenol is formulated to hold its presence and not deplete as rapidly when formulated with an amine. The same rule would apply to an amine-only formulation. These anti-oxidants help keep the free radical oxides from taking over the system and creating “varnish”. Anti-oxidants help sustain a healthy operational life for the equipment.
    • It has been discovered that as these anti-oxidants deplete, the potential for varnish is eminent and action should be taken to help remove the varnish from the system entirely.
  • Rotating Pressure Vessel Oxidation Test (RPVOT) ASTM D2272
    • RPVOT was designed to measure the oxidation stability of a turbine oil in minutes. The lubricant is placed in a vessel containing a polished copper coil. The vessel is charged with oxygen and then placed in a bath heated to a constant temperature of 150 °C. The vessel rotates while submerged in the bath and will stop once a drop of 25.4 psi is reached from maximum pressure.
    • When the test is complete, the RPVOT results are divided by the starting value RPVOT of the new lube to calculate the overall percentage of remaining useful life.
    • Calculation %=RVOT test result ÷ RPVOT new lube
      • Values of >55% are within the acceptable limits for the method and no action is needed.
      • Values of 55-45% are approximately half of the products starting life and sweetening is recommended.
      • Values of 44–26% indicate low oxidative stability. The possibility for sludge formation and discoloration is likely, and sweetening the sump is recommended.
      • Values of <25% is an indication the oxidative stability is extremely low and change of lubricant is advisable.
    • RPVOT testing is essential to for turbine oils this test helps determine when to schedule downtime and maintenance actions.

It is believed that as the antioxidants deplete, there is an increased potential for varnish formation. LSV Ruler testing is recommended to help monitor the antioxidant properties as well as the presence of varnish formation via MPC. As these antioxidants deplete, the presence of varnish forming can be captured on the MPC. These two tests can be used to help correlate any decreases or increases in antioxidants and monitor any changes/improvements with the presence of varnish. The same correlation can be used with RPVOT as the values decrease or are <44% the potential for varnish formation.

Click here for a complete list of testing performed by POLARIS Laboratories®

Proven Impact. Proven Uptime. Proven Savings.
Let us prove it to you.

Published May 1, 2018

8 Tips for Setting Flagging Limits

Our customers often ask us to display the condemning limits for the tests performed on their sample, on the actual sample report they receive. Believe it or not, there is a reason why we exclude the limits from the report. It’s not a simple case of we are unable to, or we do not want to. The real reason relates to the complexity of using the correct limits for each parameter, based on several pieces of equipment and application information; as well as looking at trends of historical samples from the same unit, rate of change and any other applicable information relating to the sample and component. These differentiating factors result in limits changing dynamically on a sample by sample case, dependent on this information.

When setting limits, the following information must be taken into consideration on each sample, below are some examples:

  1. Equipment Type: (e.g. hydraulic)
  2. Specific Application: (e.g. Injection Moulding Machine)
  3. Equipment Manufacturer: (e.g. ARBURG)
  4. Equipment Model: (e.g. 1120H)
  5. Industry Type: (e.g. industrial manufacturing)
  6. Filter Type: (e.g. INLINE)
  7. Filter Micron Rating: (e.g. 10 micron)
  8. Sump Capacity: (e.g. 1000 litres)

Once limits are set, it’s best not to use them exactly. If for example, the iron ppm condemning limit for a hydraulic oil sample is set at 30ppm, customers may not expect the iron result to be flagged until it exceeds 30ppm. However, if historical samples from the same unit have consistently shown iron results of less than 5ppm, and on the latest sample the results are 22ppm, this is considered an abnormal trend, and exceeds expected Rate of Change values. In this instance, the result of 22ppm would be flagged as abnormal for these reasons, but is still below the statistical condemning limit level of 30ppm. So, if we did display this limit of 30ppm on the sample report, the customer may ask why the result has been flagged at 22ppm as it is under the threshold, which would in turn lead to more confusion and questions. Another important point to note is that combinations of metals present also affect the limits used, as they may indicate abnormal wear to a specific component.

Most OEM’s will provide some form of condemning limits in their technical bulletins or operational guides, but often come with the caveat that ‘these fixed limits should only be used if the laboratory cannot provide limits based on robust statistical analysis of previous results’, which further confirms the need for an accurate statistical model to be used on all samples tested.

Click here to read more information on setting limits


Proven Impact. Proven Uptime. Proven Savings.
Let us prove it to you.

Published April 24, 2018

POLARIS Laboratories® + Reliable Plant 2018

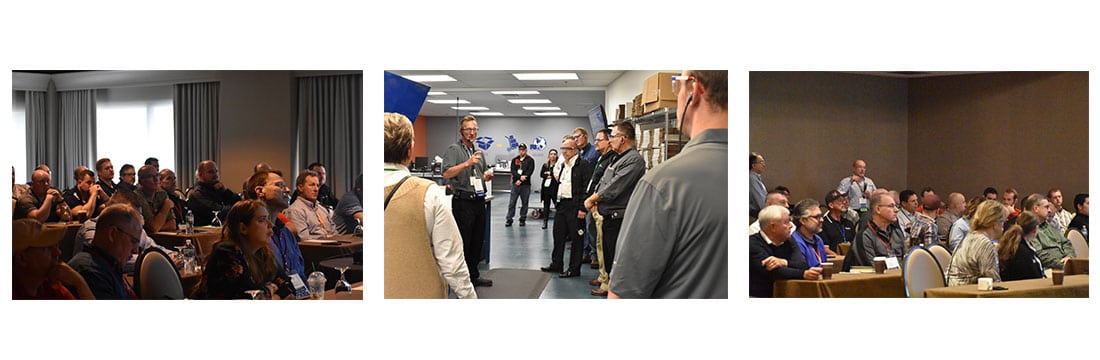
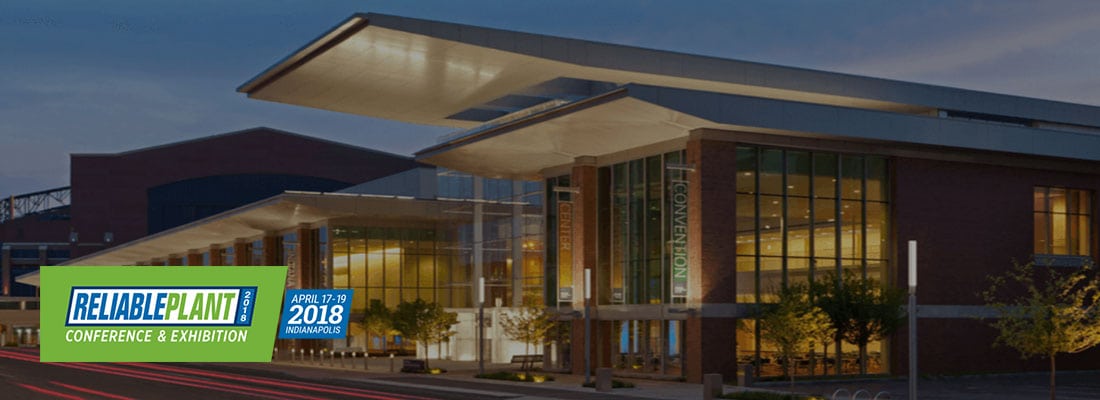
POLARIS Laboratories® experienced succesful networking and visibility at the NORIA Reliable Plant Conference and Exhibition April 17-19. The conference welcomed hundreds of lubrication, oil analysis and maintenance professionals to Indianapolis. POLARIS Laboratories® was proud to be a premier sponsor of the event and provided many opportunities for attendees to network and learn about proven fluid analysis services.
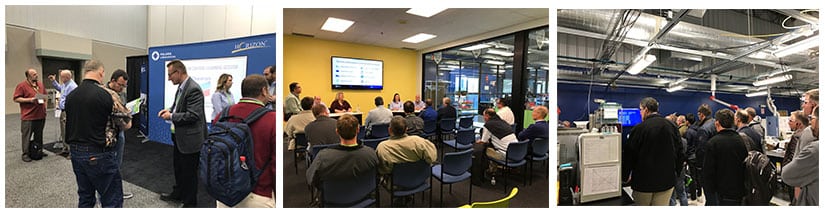
The pre-conference workshop, Identifying the Causes of Contamination and the Actions That Mitigate Them, presented by POLARIS Laboratories® technical business consultants, Randy Clark and Henry Neicamp, proved to be a great success.  The workshop dived deeply into what causes fluid contamination and the actions to take to reduce equipment maintenance costs.

Contamination control also was the focus of four POLARIS Laboratories®-sponsored learning sessions during the conference taking place on Tuesday and Wednesday of the conference. Each of these learning sessions sparked interest in many of the conference attendees and resulted in a high attendance rate.

The POLARIS Laboratories® facility tour brought more than 60 Reliable Plant attendees to our Indianapolis laboratory location to tour our state-of-the-art, accredited laboratory, participate in a discussion panel and engage in timely networking. Reliable Plant attendees arrived at the POLARIS Laboratories® facility Wednesday evening and were guided, by our Chief Executive Officer, Bryan Debshaw, through our laboratory facility and office space. Attendees learned the ins and outs of how our laboratory and support operations help our customers achieve greater maintenance success and save more of their equipment.

We would like to thank all the Reliable Plant attendees who participated in one of our sponsored conference opportunities! If you’re interested in learning more about how our fluid analysis services can reduce maintenance costs and generate proven results contact us!

Data Extraction Made Easy

It’s not just fluid analysis, it’s what you do with it” is something we say a lot here at POLARIS Laboratories®. We strive to help our customers extend the life of their equipment – we do this through not only laboratory testing, but extensive data generation and analysis. While some consider us just “the laboratory”, we pride ourselves on being more than that. By providing you with in-depth analysis and maintenance recommendations, you can address any maintenance issues early.

Data Overload

We test and analyze thousands of samples daily, each generating dozens of individual data points. With different types of components, fluids and severities potentially spread out over multiple accounts, the amount and complexity of data can be hard to decipher. This is especially true if the extent of your data management is simply just receiving sample reports in your email inbox. What do you do with all of that data?

There’s a Solution

Fortunately, our information technology department has developed a number of helpful and innovative tools within our online data management tool, HORIZON®, to help with this. Along with real-time dashboards, we have a number of pre-made reports that most likely can answer most of the questions you may have regarding your sample data. But what happens when there is not a pre-made report available? If you are the analytical-type and know your way around Microsoft Excel (everyone’s go-to Business Intelligence tool), you might just want the raw data so you can do your own analysis. The tool in HORIZON that gives you the ability to do that just that is called Data Extraction.

Customize

Data Extraction is a simple tool within HORIZON that gathers data based upon customized criteria you set and exports it into an Excel-compatible file. Let’s say you wanted to compare two different locations that had severity 3 and 4 rated components for the last quarter. With Data Extraction, you can easily generate this report in Excel so you can go filter or use Pivot Tables to see what is potentially driving those severities.

How It Works

We have recently made some changes in the way the Data Extraction queries are processed and the results are impressive, with reports being generated in seconds. Give Data Extraction a go and see for yourself.

  1. Go to HORIZON and log in
  2. Click on the Management Reports tab
  3. Select Data Extraction Tool from the left-hand navigation
  4. At this point, you can easily select the filter criteria for the report you want to generate
  5. When you have finished selecting your criteria, click Run and the file will generate and download

If you would like to see a walk-through demonstration on how to run a Data Extraction report, click here to watch the video in our Technical Library.

Our goal is to help companies like yours save more of their equipment and strive to provide the resources to do so. We welcome any feedback on the functionality of this report and any other features you’d like to see in HORIZON.

Proven Impact. Proven Uptime. Proven Savings.
Let us prove it to you.

Published April 10, 2018

Fluid Analysis 101: 5 Tips to Collect the Best Sample

Obtaining a truly representative fluid sample from your equipment or machine is the most critical part of a successful fluid analysis program. Without a true, accurate representation of what is going on inside your equipment, the analysis conducted may prove to be of little value in determining the condition of the machine at the time of sampling.

The particles and elements of wear, corrosion, fluid degradation and contamination provide the necessary diagnostic information concerning both the fluid and the machine. These particles can settle or separate out from the fluid, causing an uneven distribution throughout the system. So, choosing the right sampling point is very critical. Below are five tips to follow to ensure you collect the best sample possible.

  1. Take the sample from a point that provides plenty of turbulence in the fluid to ensure the particles are well mixed. 
  2. If you’re sampling from a filtering device, samples should be taken upstream.
  3. For trending, it is best to take the sample from the same location, depth etc. on the equipment – every time.
  4. Where possible, take the sample while the equipment is in operation or within 30 minutes of shut-down.
  5. The best sample points to collect the fluid are different depending on the type of equipment. The chart below outlines some of the best sample points:

To achieve a successful, effective fluid analysis program, the sample has to be truly representative of the equipment or fluid condition. This can only be accomplished if samples are taken from the same proper sampling points each time – this also helps to establish maintenance trends. To ensure you get the most value from your fluid analysis program – and to experience increased uptime and cost savings – follow these easy sampling tips.

Proven Impact. Proven Uptime. Proven Savings.
Let us prove it to you.

Published April 3, 2018

Elevate Your Fluid Analysis Program and Save More Equipment

Four years ago, several of my colleagues presented a proposal that could simply be billed “if you build it, they will come”. This proposal involved building a groundbreaking, customer-focused event hosted by an independent fluid analysis laboratory. What started as a cautious experiment in 2015 to educate and train our customers on the strategic value of an effective fluid analysis program has grown into a mainstay that brings together more and more customers each and every year. It’s our Customer Summit.

In past years, we’ve focused on issues that matter most to maintenance professionals and fluid analysis leaders. Driving Action. Champion Impact. Connected Performance. Now in 2018, we bring you a summit that focuses on Elevate. Our fourth annual Customer Summit is set for November 5-7, 2018, at the Alexander Hotel in downtown Indianapolis.

Elevate will help our customers sharpen their focus and take their fluid analysis program to the next level. With a dynamic and diverse speaker lineup in the works, we are committed to helping you close the gap and build a fluid analysis strategy for the future.  We’ve structured this summit to be for maintenance professionals by maintenance professionals. We simply provide a platform for key players at companies like yours to learn through peer-to-peer conversations. In turn, our customers leave with a better understanding about what needs to be improved, accelerated and leveraged the most in their programs. You can’t afford not to engage in these conversations – so we encourage you to come experience it first-hand at the 2018 Customer Summit this November.
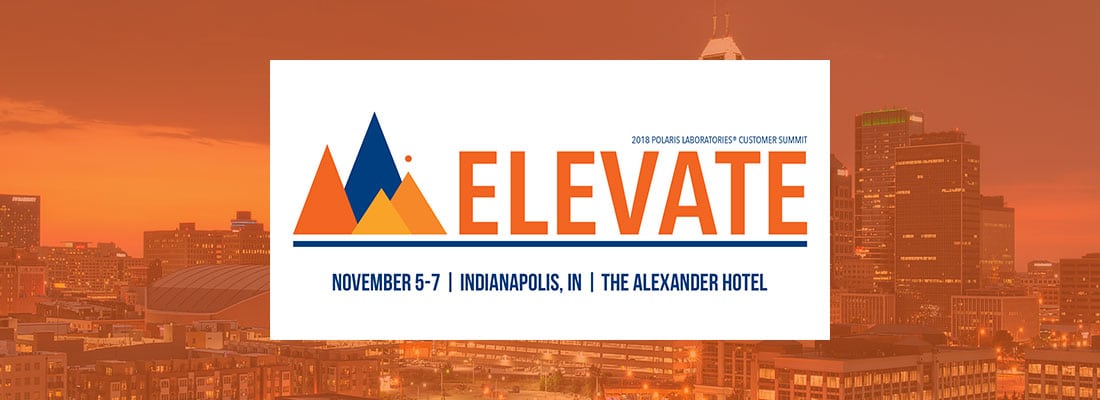
Building on past feedback from nearly 200 customers across more than 90 companies, the 2018 summit will provide greater variety and depth in the content we share. This is a must-attend for new and returning customers. Specific content will include new insights on:

  • Expanding and maximizing your program
  • Securing greater executive support
  • Importance of proven impact, uptime and savings
  • Contamination control
  • Business impact initiatives to improve fluid analysis
  • Innovative technological solutions to maximize your program
  • Optional lab tours before and after the summit schedule

Mixing work with some memorable fun and networking is how we do it. What’s more, we do it in a way that is affordable for multiple members of your team to attend.

Are you ready to take the next step elevate your fluid analysis program? Then clear your calendar in November and join us in Indianapolis at the 2018 POLARIS Laboratories® Customer Summit. We’ll circulate more details when registration opens in late April! Click here to be notified when the 2018 summit registration process opens.

Proven Impact. Proven Uptime. Proven Savings.
Let us prove it to you.

Published March 27, 2018