Go Digital with Your Condition Monitoring

As the industry continues to grow in the digital landscape, POLARIS Laboratories® is always looking for ways to maximize customers’ access to technology. With tools such as Component ID Tags, QR-Code-Only Sample Labels and the HORIZON® mobile app, our customers can digitally customize how they manage their fluid analysis programs.

QR-Code Only Sample Labels

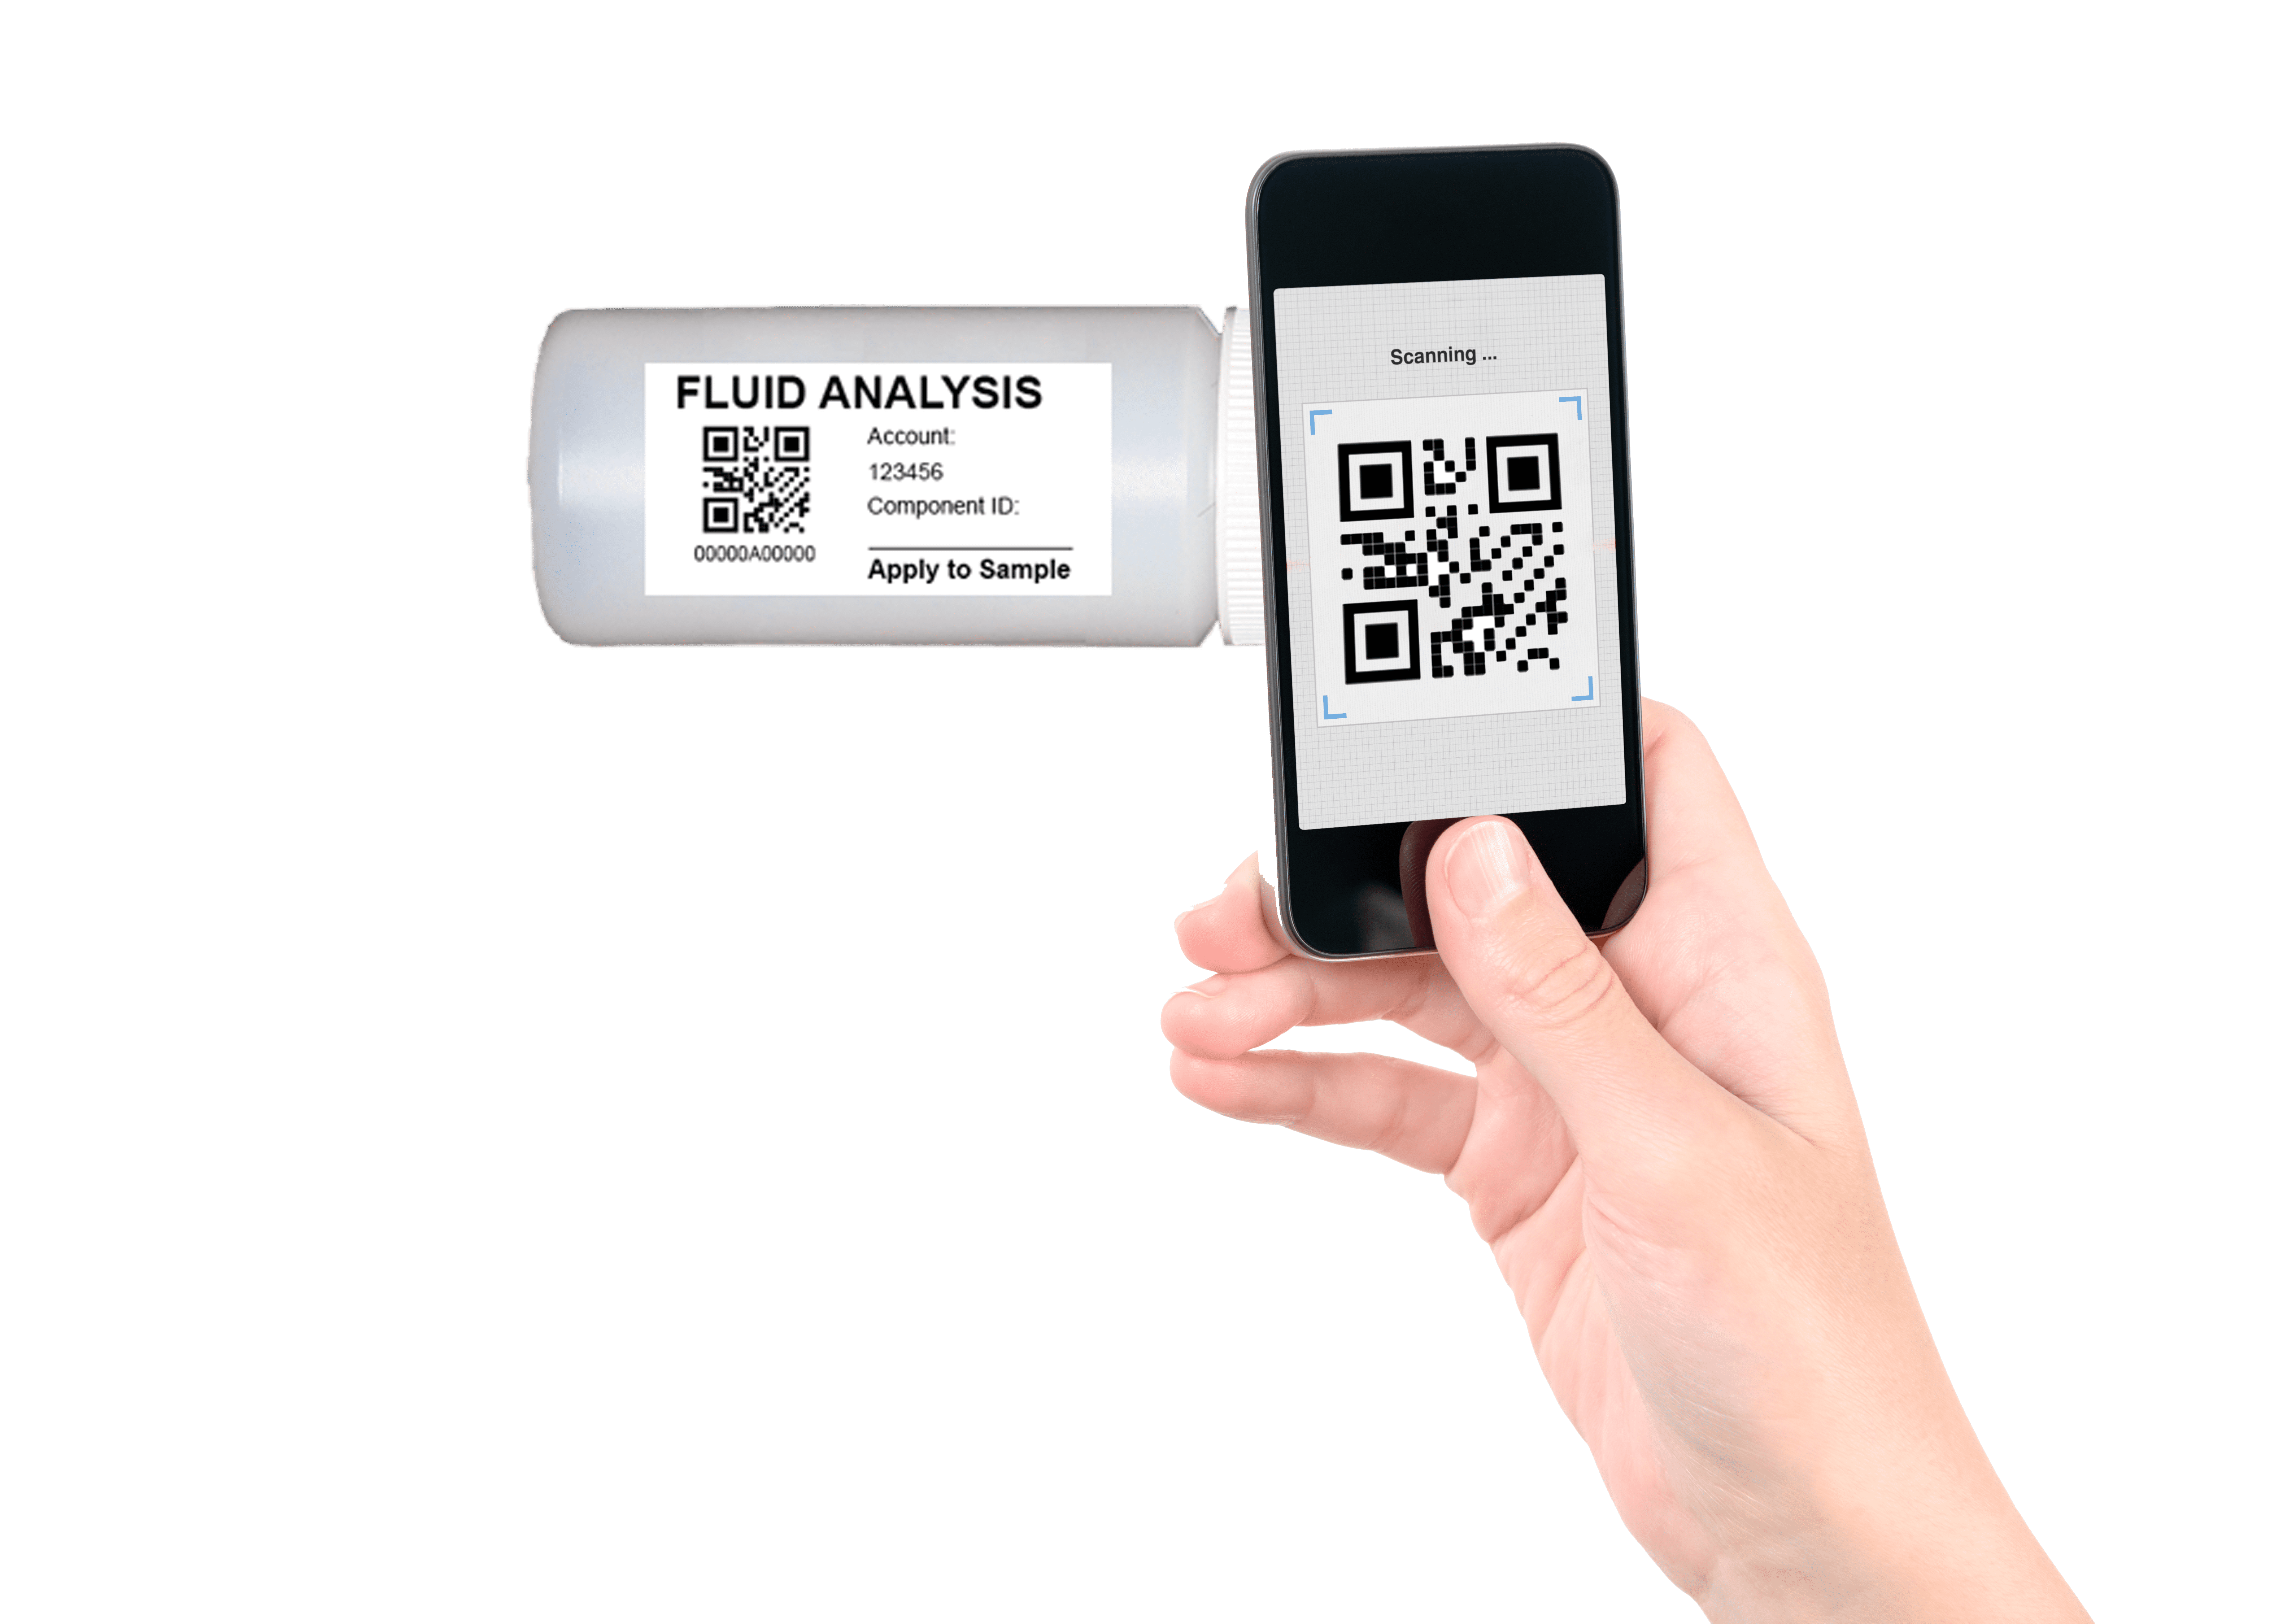
QR-Code Only Sample Labels contain a unique barcode number linked to a specific fluid sample, made to easily apply to the surface of the sample bottle. By transitioning to QR-Code Only Sample Labels, customers can reduce the costs of kits while simultaneously improving the overall carbon footprint.

Start using QR-Code Only Samples and:

  • Eliminate handwritten submissions
  • Minimize paper waste
  • Accelerate result time
  • Manage previous submission information
  • Save on costs of kits

Read more on QR-Code Only Sample Labels

Streamline Submissions Through Component ID Tags

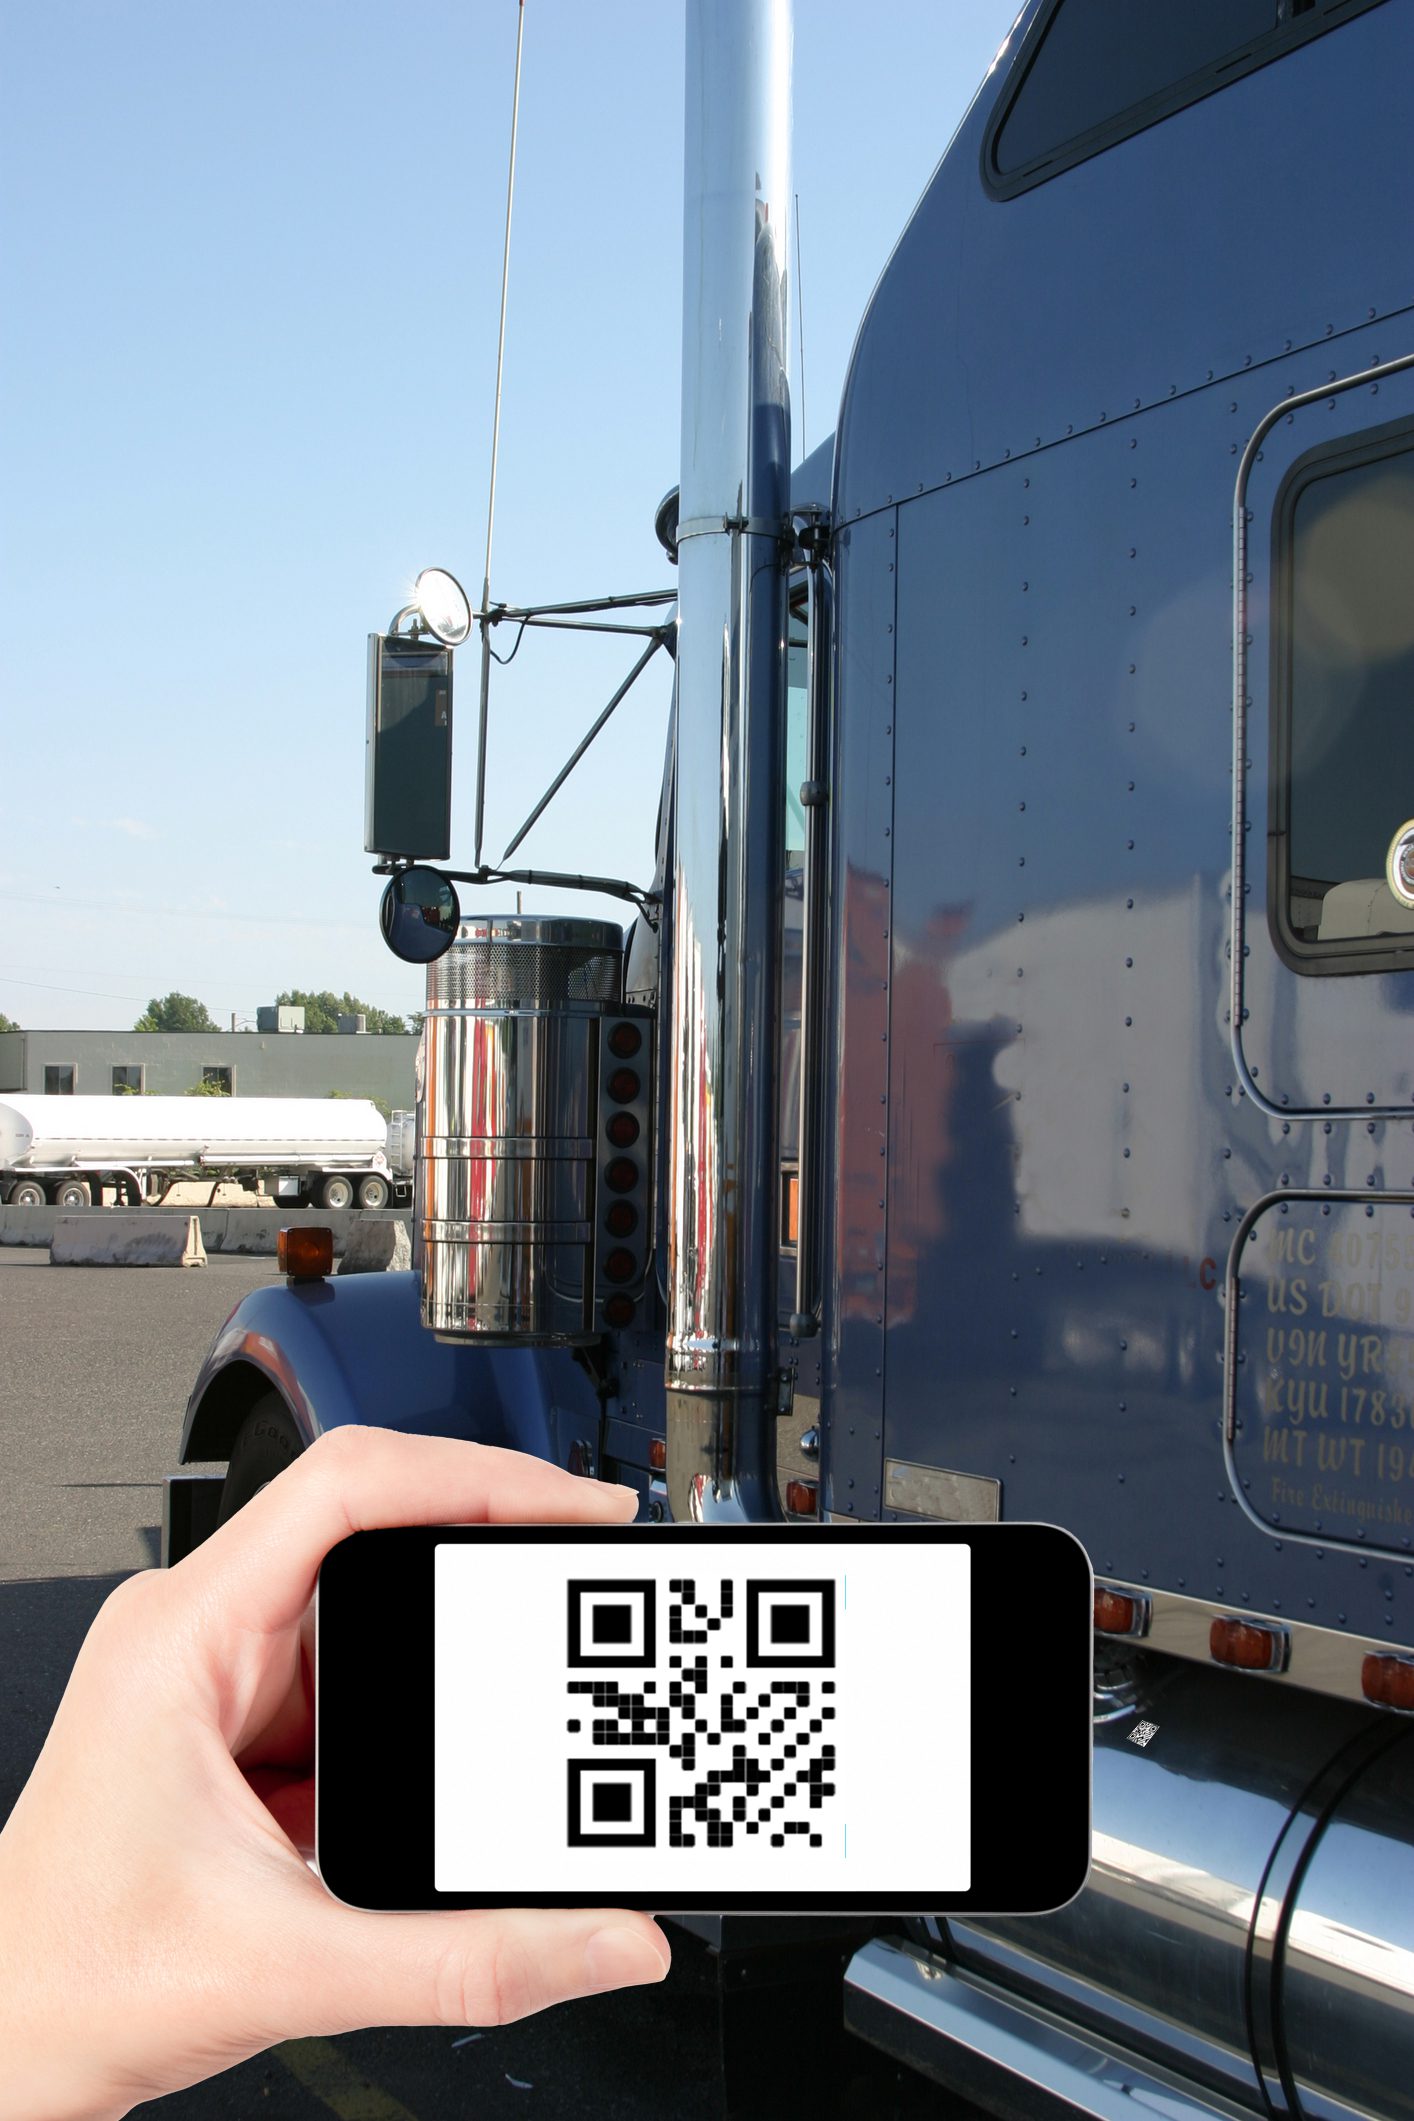
Registering equipment information has been made easier using Component ID Tags. Implementing the use of these QR tags minimizes time spent registering samples in HORIZON and ensures data accuracy.

Use Component ID QR Tags on equipment and:

  • Eliminate manually entered ID’s
  • Maintain component ID integrity
  • Decrease registration steps
  • Increase productivity

Get Connected Anywhere Through the HORIZON Mobile App

Implementing the use of QR codes works in tandem with the HORIZON mobile app. Customers can avoid paperwork and access fluid analysis data in HORIZON anywhere, anytime. The HORIZON mobile app gives customers unlimited access to view their equipment list, sample data history, view reports and more all within the reach of their pocket.

The mobile app allows customers to:

  • Register samples
  • Scan QR codes
  • Receive and view reports
  • Add and duplicate equipment
  • Set up custom alerts based on report severity

The mobile app allows customers to edit fields including:

  • Component ID
  • Fluid type
  • Component type
  • Manufacturer
  • Model
  • Filter type
  • Application

Stay Alert Anywhere You Go

Keeping up with the digital age and taking your fluid analysis program digital means quicker sample registration and faster response time to critical issues before they turn catastrophic.

POLARIS Laboratories® prioritizes our customers’ reliability through providing services that increase program efficiency. As we continue to innovate using technology to streamline our programs, we hope customers utilize these tools to effectively monitor their equipment.

Introducing Our New Mascot: Beecon, the ReliaBee

Introducing Our New Mascot: Beecon, the ReliaBee

In celebration of POLARIS Laboratories’ 25th Anniversary and the significant advancements driven by our dedicated team members and valued customers; we are proud to unveil our new mascot. Meet Beecon, the Reliabee!

Putting the B in Reliability

Beecon represents our steadfast commitment to excellence, collaboration and dedication in assisting our customers achieve peak equipment reliability through fluid analysis. At POLARIS Laboratories®, we strive to provide accurate, reliable and timely results, personalized customer experience, expert recommendations and collaborative insights.

A Beecon Towards Value

Much like our guiding POLARIS star, the name Beecon symbolizes both aiding navigation and orienting position or location. From the very beginning, POLARIS Laboratories has prioritized delivering state-of-the-art navigational data management and integration technology solutions aimed at ensuring our users achieve total equipment reliability. Through HORIZON®, our customers gain access to a robust suite of information and tools that help them take their maintenance program management capabilities to the next level.

Sample Data as Sweet as Honey

Actionable maintenance recommendations, expert analysis and accuracy of test results are integral to the operational efficiency at POLARIS Laboratories®, reflecting the meticulous processes observed within a beehive. Much like bees maintain hive health through careful oversight and teamwork, our customers rely on us to help them improve operational efficiency, predict maintenance and optimize fluid drain intervals safely. POLARIS Laboratories® is the “Beecon” on our customers’ reliability journey, guiding them with precision and clarity.

Welcome, Beecon the ReliaBee

At POLARIS Laboratories®, we value the dedication of our teams, ensuring smooth and efficient operations. Our commitment to engaging customers in effective maintenance strategies reflects our core values. Beecon exemplifies the reliability, performance and excellence that define POLARIS Laboratories®.

Published July 9, 2024

Staying Cool for the Summer: How to Utilize Coolants During Hot Temps

With the summer months coming, assessing your cooling system is more important than ever to prevent equipment overheating.

As the outside temperatures rise during the summer months, equipment concerns come into focus. Engine metallurgy and lubrication relies on a specific temperature range while in-service. Anything outside of this range will result in reduced efficiency and prolonged exposure to high internal temperatures will increase component wear and lubricant stress. The viscosity of the lubricant is crucial for providing a fluid film to avoid metal to metal contact. Overheating will cause the lubricant’s viscosity to become too thin for proper protection. This affects lubrication, resulting in friction, wear and shortening the lubricant’s capabilities to provide proper protection to the system.

The Functions of a Cooling System

The cooling system becomes a driving reminder to the importance of regulating the engine temperature. The cooling system must be able to circulate coolant, remove heat from the system and dissipate the heat. To keep overall internal temperatures stable during outside temperature shifts, the cooling system must function correctly. However, if one of the functions cannot perform properly, this will cause a snowball effect of concerns.

The effects of temperature, pressure, flow on the cooling system operation, will noticeably impact equipment health. Corrosion in the cooling system occurs at a slower rate than engine wear; however, up to 40% of preventable engine failures are traced back to the cooling system. Concerns with the lubricant and engine performance may be a sign of cooling system issues.

Click here to read more on the effects on the cooling system

The Importance of Coolants

Coolant in the cooling system plays a critical role in the ability to transfer heat and prevent corrosion protecting the overall system health. Overheating is a common concern due to coolant property issues. Increased summer heat might also increase unexpected failures. The frequently acknowledged coolant properties that are reduce corrosion in the cooling system and lubricant concerns are:

• Glycol Concentration
• pH
• Corrosion Protection Inhibitors
• Concerns of Contamination
• Degradation Acids

Maintaining Coolant Systems for Improved Longevity

Coolant chemistry reactions occur due to mechanical issues, coolant property concerns or contamination of the system. Warmer temperatures should not keep your equipment out of service or increase lubrication costs. Maintaining your cooling system can be a simple task to avoid resulting in a neglected system. Understanding coolant and equipment demands is key to proper maintenance in the field. With consistent maintenance, the coolant and equipment health can provide adequate functions to protect and remove heat from the component parts as needed.

A proper fluid analysis program should include assessing all fluids in the equipment. Your fluid analysis program will remove maintenance guesswork for whether the equipment components are appropriately supported and protected or not. With trend analysis, you can reliably catch concerns and are able to act on the recommendations and address the issue before further damaging your equipment. Reach out to our team today to see how we can help see your fluid analysis program succeed and achieve your ROI.

Contact Us Today

Published June 25, 2024

25 Years Strong of Proven Impact, Uptime & Savings

Since opening our doors in 1999, POLARIS Laboratories® has had a mission to provide reliable data, analysis and information to our customers so they can save more equipment.We started off with big ambitions with Jeff White, Mark Minges, Don Woods, Robin Batt, Kevin Batt leading the charge and Bryan Debshaw joining with his aligning entrepreneurship vision soon after. From there, the company has evolved into the POLARIS Laboratories® we all know today. From every corner of the company, we pride ourselves in providing our customers with reliable information and maintenance recommendations and will continue to provide the same quality results for the next 25 years and beyond. While looking back at our last quarter century of achievements, we want to commemorate the vast amount of progress we’ve made as a team since the very beginning.

The journey of POLARIS Laboratories® has been remarkable. In celebration of our 25 years working with brilliant minds and dedicated customers, we would like to take you all on a tour of our history and accomplishments throughout the years.

The POLARIS Laboratories’ Impact on Savings 

POLARIS Laboratories® has been hard at work ensuring our customers get the best results when they need them the most. Through 25 years of testing, analyzing and providing insights into equipment-saving actions, we’ve produced:

  • 68,000+ pieces of equipment saved from failure
  • 2,800,000+ critical severity reports delivered
  • $300,000,000+ customer maintenance dollars saved

It is hard to believe the amount of hard work and dedication those in our labs and other sectors of POLARIS Laboratories® have contributed to build the reputation we have now. The impact we have made by continuing to push limits and set new goals for ourselves has driven our company since its very foundation.

The Gallery of POLARIS Laboratories® Major Projects

From 1999 to 2024, the number of projects and accomplishments has only grown and expanded. Some value-add services we’ve built up in the years we’ve grown include:

Increasing fluid testing, lab openings, available platforms and more has given our customers more options than ever. We started with oil and continuously expanded our expertise into coolants, fuel and grease. Eventually we’d extend into specialties such as Filter Debris Analysis (FDA), Micopatch, and Analytical Ferrography (AF). Our understanding of the usefulness of tools and applications has allowed us to continuously expand our offerings to meet our customers’ needs.

The POLARIS Laboratories’ Global Expansion Timeline

Through the goal of building up our laboratories, we aimed to bring our services to as many customers as possible as we’ve expanded globally. The timeline of our growing laboratory locations include:

Indianapolis – 1999                                                                           Houston – 2003

Salt Lake City – 2005                                                                        Edmonton, Canada – 2008

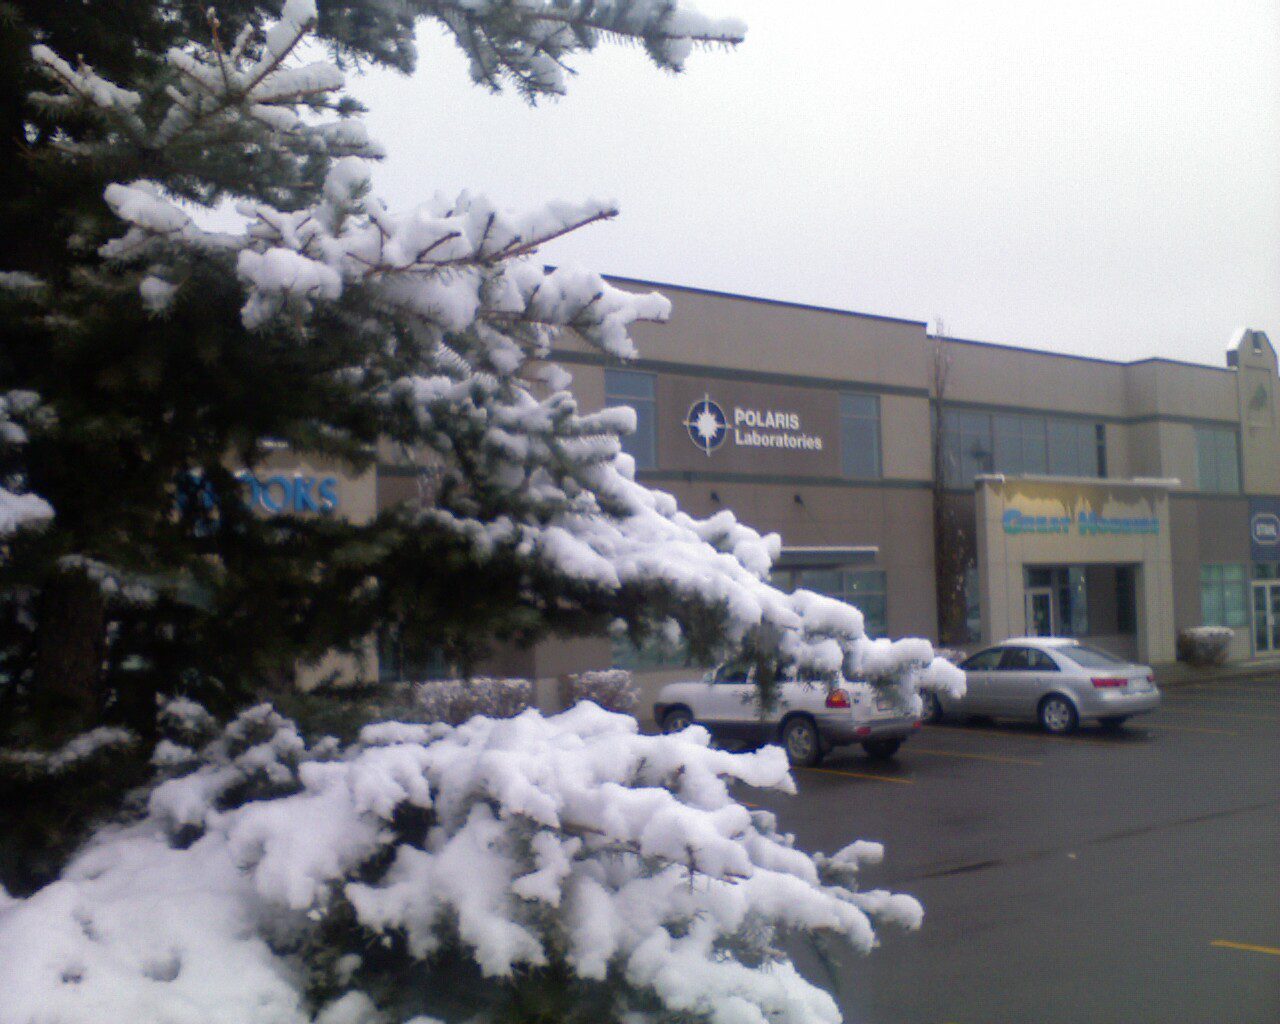
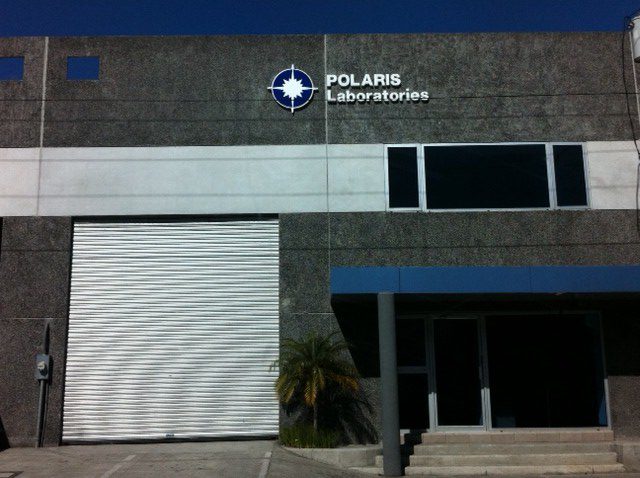
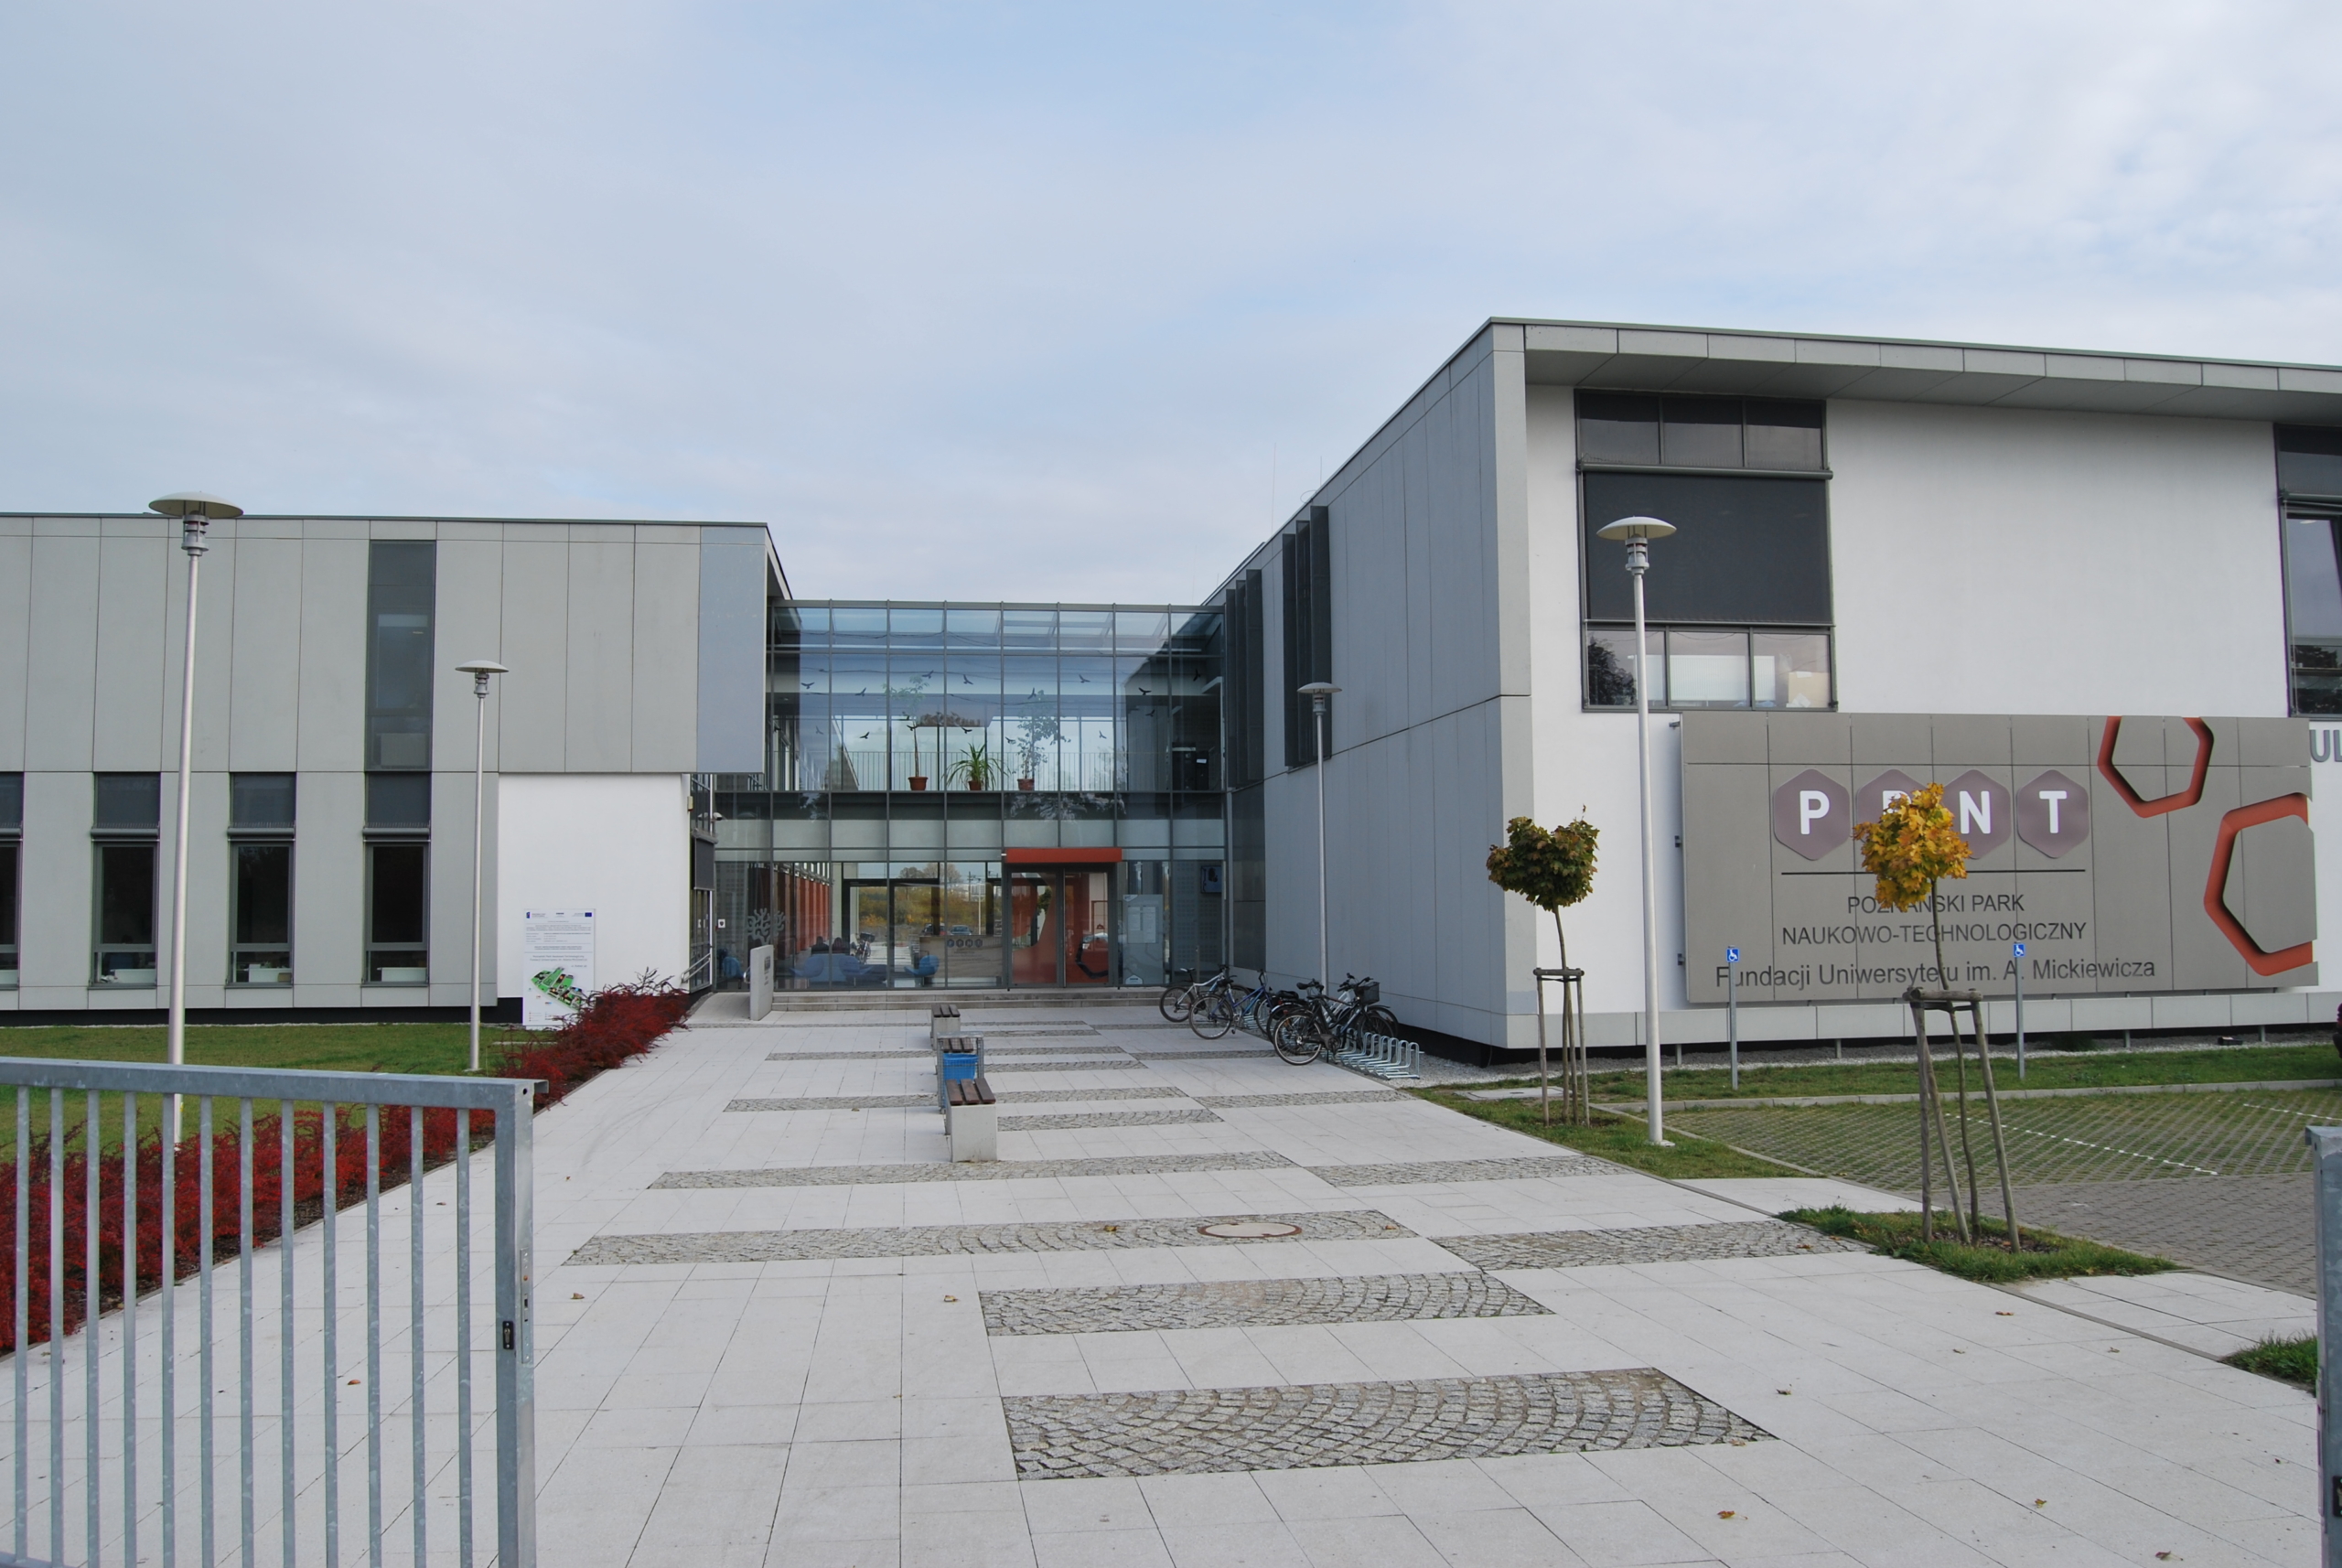
Guatemala City – 2011                                                                                      Poznań, Poland – 2013

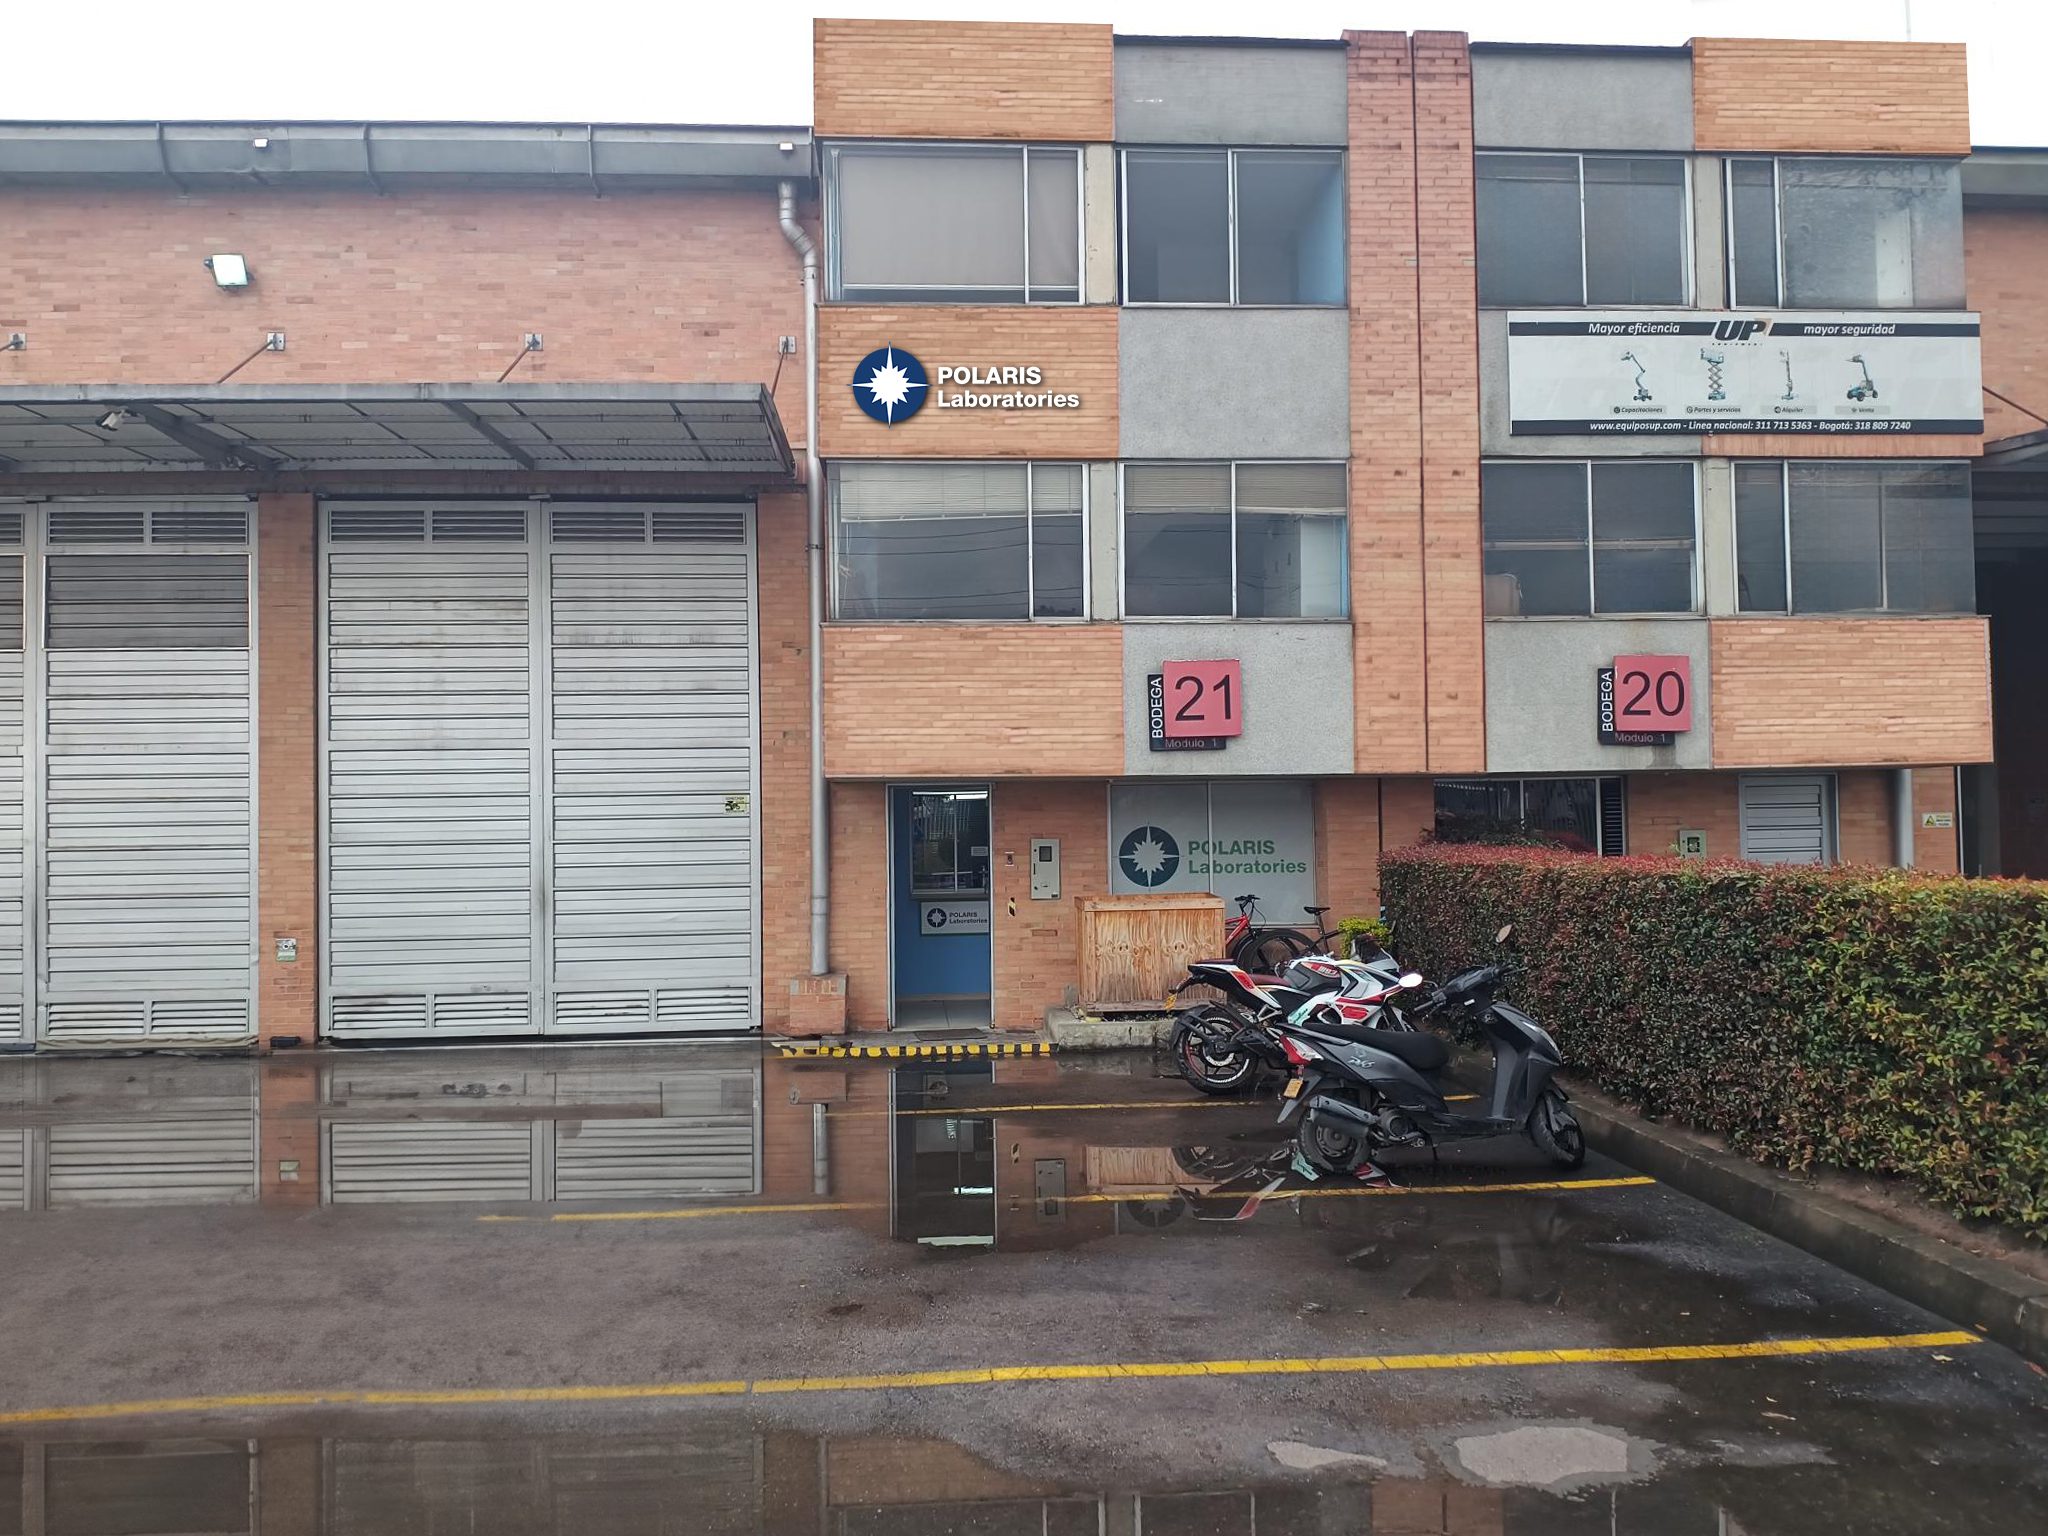
Bogotá, Colombia – 2020

Though our roots are in Indianapolis, our goal is to expand to help as many customers as possible. As our services grew nationally, we saw potential in building new foundations for customers in need of fluid analysis internationally. From Edmonton to Bogotá, we continued to lend our services worldwide in hopes of advancing the number of locations our customers can utilize for their analysis.

The POLARIS Laboratories’ Mission

One of the major elements POLARIS Laboratories® represents is the sense of dedication, innovation and discovery. This 25-year long journey that so many people have been part of has been astounding. From a single location in Indianapolis to now operating in multiple regions, the POLARIS Laboratories® name has been a beacon for discovery for many throughout the years. From those who operate under the POLARIS star to those who have journeyed under the star with us, we all come to acknowledge the dedication put into making us shine. Celebrating 25 years of discovery.

Published May 1, 2024

Offroad Equipment: Combating Critical Conditions

Nothing derails your equipment reliability more than a critical failure or accident while in operation. In today’s market, there is a high demand for equipment due to the average lifespan for most fleets being only four years. However, because of supply issues and current economic conditions, many are looking to extend the life of their fleet.

Identifying the Issue

Harsh operating conditions, extreme load variations and the high-dollar costs involved in downtime and equipment replacement make fluid analysis a necessary part of doing business in the off-highway (construction/aggregate) industry.

Heavy-duty equipment is expected to maintain maximum performance levels. Despite being required by this industry; they’re often exposed to daily uncontrollable environmental factors. This includes moisture, abrasives, and temperature. Contamination and wear are imminent and when left unchecked, can halt production in a heartbeat.

Discovering a Solution

Routine testing identifies small problems before they become major failures, allowing you to meet the high demands of your customers on time and on budget. Maximize asset reliability and regain control of your production by monitoring all fluids associated with the asset through analysis to identify wear-causing contaminants, fluid properties and their effect on component performance.

Asset Monitoring

All components of the asset must be monitored and these can vary based on the type of asset. Components with the most assets include:

  • Prime mover (engine)
  • Gear systems (transmissions, final drive/differentials)
  • Hydraulic systems
  • Integrated cooling systems (which provide cooling for engine, transmission and hydraulic systems)

Monitoring of the fluid properties can differ based on fluid and component. For example, engine oil we monitor for wear properties.

Fluid Properties:

  • Oil – The viscosity, as well as its ability to neutralize acids and disperse and suspend soot particles produced during combustion, can indicate if anti-wear additive and dispersant/detergent levels are providing sufficient engine protection and have good oxidation stability to prevent sludge from forming.
  • Coolant – There’s more to coolant analysis than testing coolant formulations – it’s about identifying problems within the cooling system that can be detrimental to engine performance and lead to premature engine failure.
  • Field Testing – Monitoring visual characteristics of the coolant using test strips to determine corrosion protection levels, pH and or freeze point. Field testing conducted on-site should be used as a screening tool to determine if laboratory testing is required earlier than scheduled.
  • Laboratory Testing – Determining the validity of concerns with corrosion of system metals, hard water contamination, early degradation breakdown of glycol and other chemical properties. Laboratory testing is typically recommended to be conducted twice a year for normal use engines (Spring & Fall) and every quarter for high-hour or extreme duty engines.

Contamination:

  • Abrasives – Dirt and silica can contaminate your oil, causing excessive wear on the equipment
  • Water – Can wreak havoc on the operating performance and cause severe damage to the equipment

Why is Information so Important for Analysis?

There are complex interpretation factors accounting for each test result of the respective application. This includes samples defined as grease, diesel fuel, lubricant or coolants.  Without the specific equipment model, a laboratory may have to rely on generic data points to extrapolate typical wear accumulation. These limits could either be too aggressive or not aggressive enough for the type of equipment tested.

A great way to gauge is by fuel. The differences between #1 and #2 diesel fuel can be seen in several laboratory tests. Diesel fuel #1 will have lower results for Viscosity, Cloud Point, Pour Point and Distillation in relation to diesel fuel #2.

Recommended Fluid Testing Should Include:

  • Oil – Elemental Metals (Wear, contaminants, additive), Viscosity, TAN/TBN, Fuel/Soot (if applicable), Water, particle count (if applicable), PQ/Ferrous density (if applicable)
  • Coolant – Elemental Metals (Corrosion, contaminants, additive), Glycol, Boil point, Nitrate, HPLC Carboxylic acids and azoles, SCA (if applicable), Specific Conductance, Hardness, Visuals and IC Chromatography (Contaminates and Degradation acids)
  • Fuel – Contact your fluid analysis laboratory to determine your needs. ASTM D975, NFPA-110 or specific issues may determine the correct testing.
  • Grease – Contact your fluid analysis laboratory to determine your needs.

Click here to view our complete testing list

Published April 23, 2024

2024 Reliability Summit: Europe

All Aboard for Reliability Training

POLARIS Laboratories® is heading to Europe for this year’s Reliability Summit for two days of reliability training lead by our industry’s seasoned veterans. Speakers will cover topics such as developing maintenance strategies, fluid analysis data management, technical with testing and more. In addition, this year’s summit gives you a chance to appreciate a gorgeous waterside view during sessions or in your free time.

Reliability Summit: When and Where?

The countdown to register for the 2024 EU Reliability Summit has begun as the conference will take place May 14, 2024 to May 15, 2024. Attendees will be headed to Rotterdam, Netherlands to enjoy May by the bay within one of the largest and most beautiful cities in the Netherlands. The venue, aboard the SS Rotterdam, invites attendees to enjoy a variety of speakers, accommodations and more.

Visit event site for more info and to register

Reliability Summit Speakers and Agenda:

We’ve brought in several reliability experts from both Technical and HORIZON® to host a range of seminars for our guests to attend. Speakers include:

Program Improvements

  • Hermen Kamp, Asset Manager – Global Projects & Assets, Mammoet
    • Reliability Revolution: Transforming Operations Through Continuous Improvement
      • May 14, 1:10 p.m. CET
  • Gwyn Simmonds, Executive Director Global Sales & Marketing, POLARIS Laboratories®
    • HORIZON: Your Gateway to Optimized Data Management
      • May 15, 10:35 a.m. CET

Technical with Testing

  • Mark Barnes – Senior Vice President, Global Business Development, Des-Case Corporation® by Timken
    • Lowering Carbon Footprint Through Aggressive Contamination Control 
      • May 14, 3:20 p.m. CET
  • Gijs van Schaik – Sales Director, EMEA RMF Systems, BV, Des-Case Corporation® by Timken
    • Lowering Carbon Footprint Through Aggressive Contamination Control 
      • May 14, 3:20 p.m. CET
  • Emily Featherston – Product Application Supervisor, POLARIS Laboratories®
    • Demystifying Coolants: Selection, Application and Maintenance
      • May 14, 04:15 p.m. CET
  • Paul Withing – Chief Executive Officer, DeltaXero
    • From Monitoring to Mitigation: Combatting Varnish
      • May 15, 09:20 a.m. CET

Reliability Summit: What’s New?

New Sails; New Sights

This year’s summit is all about learning in a stunning environment. The SS Rotterdam is majestic boat spanning 228 meters long, 28 meters wide, and 51 meters high. This historical flagship offers an impressive sight of the city and waters that coincides with POLARIS Laboratories’ vision of discovery and adventure.

Training Within the Crystal Blue City

Rotterdam, Netherlands is a magnificent city filled to the brim with culture, history and charm. Its elegance offers a unique backdrop for attending this industry professional development and maintenance conference.

Published April 11, 2024


Assessing Methods to Analyze Particles: PQ vs FerroQ

What is Ferrous Debris?

The metallic fragments that linger onto lubrication oil are referred to as Ferrous Debris and have always posed an obstacle for condition monitoring laboratories or end-user facilities. Historically, there has always been challenges with spectroscopic methods not fully analyzing the ferrous debris load lower than about 10µm in diameter.

Credit to the Swansea Tribology Centre, the PQ has globally been an essential component of oil condition monitoring programs since 1985 to combat the full analyzation limitations. The PQ is a sensitive magnetometer that measures the influence on a magnetic field and provides a quantitative result of the ferrous wear in a sample. This result can be trended with acceptable linearity over a wide range of ferrous debris concentrations and particle sizes.

Limitations and Solutions of PQ

PQ comes with certain limitations that can disrupt the process of receiving accurate measurements for Ferrous Debris amounts. These limitations include bottle measurements only analyzing around the bottom centimeter or standards not being available from the manufacturer, thus not NIST traceable. Additionally, there is the issue that the result are unitless due to the PQ Index referring to a dimensionless number.

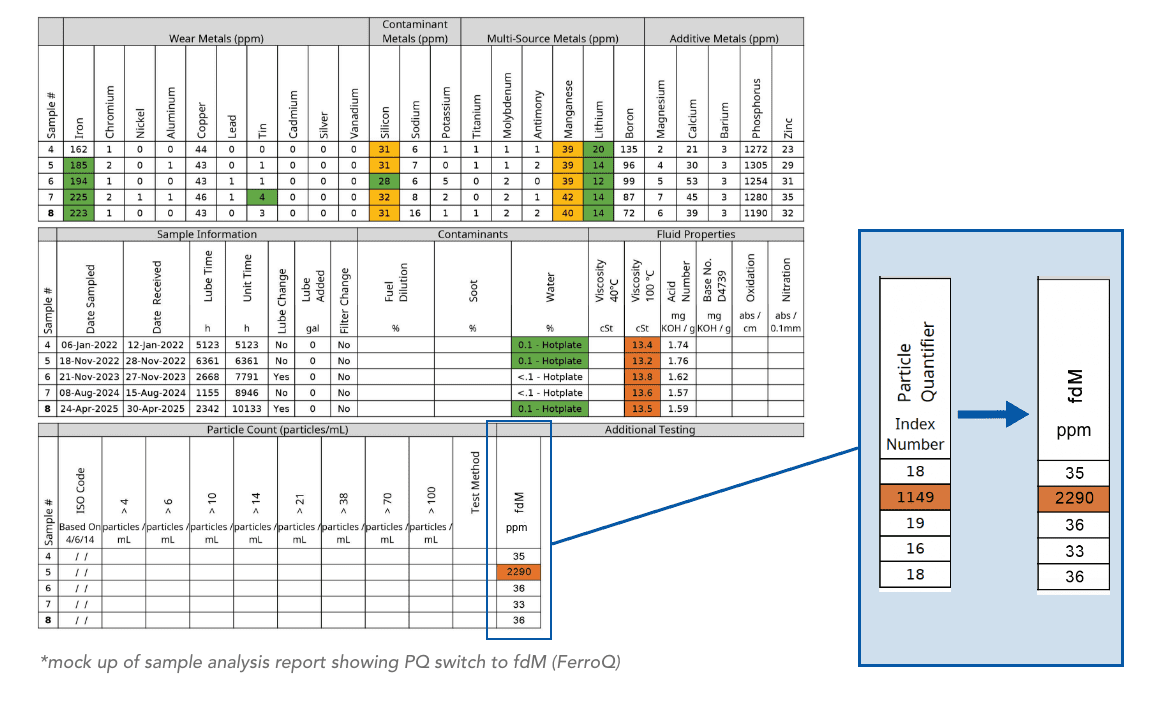
Fortunately, newer instruments such as Poseidon FerroQ was developed to meet these limitations which uniquely uses a set of coil windings; one for measurement and one for reference. When the sample is inserted, any ferrous material present in the oil/grease sample changes the inductance of the measurement coil relative to the reference coil. A sensitive signal conditioning circuit detects those minute changes in inductance of the measurement coil and the embedded processor interprets this signal to provide a mass/volume output based on calibration standards.

Single coil products such as PQ and certain PPM devices typically yield different results than set coil products such as FerroQ. This results in a device that is highly sensitive to particles at the bottom of a sample and insensitive to those at the top. FerroQ measurement coil surrounds the sample, providing uniform sensitivity, and superior repeatability.

How FerroQ is Measured?

The FerroQ reports results in mg/kg and utilizes standards that are NIST traceable back to a primary iron standard. This gives a result that is quantifiable and meets quality standards more fully.

To confirm the traceability and accuracy of the results from the FerroQ, 0.0151g of Iron Powder, <10 µm, ≥99.9% trace metal basis from Sigma Aldrich was prepared in 10.0007 g total of a UV reactive resin. The theoretical result was 1510 mg/kg.

Tube Replicate 1 Replicate 2
#1 1620 mg/kg 1630 mg/kg
#2 1610 mg/kg 1640 mg/kg
#3 1590 mg/kg 1590 mg/kg

There is a desire in some laboratories to switch from the venerable PQ to the FerroQ. To determine this, 1291 comparisons were made.

Using all data did show that above 1000 PQ™ Index the data did have a skew. This is likely the effect of PQ™ does nor analyze the whole sample.

Removing this data shows a definite correlation between the two methods:

In summary, the FerroQ technology shows that it will perform similarly to the PQ technology. This coupled with the FerroQ having NIST traceable standards, reporting in mg/kg, and analyzing the entire sample (as opposed to only the bottom) that it may be a superior method to the venerable PQ.

Proven Impact. Proven Uptime. Proven Savings.

Let us prove it to you.

Published March 21, 2024


POLARIS Laboratories’ Houston Texas Laboratory is Moving!

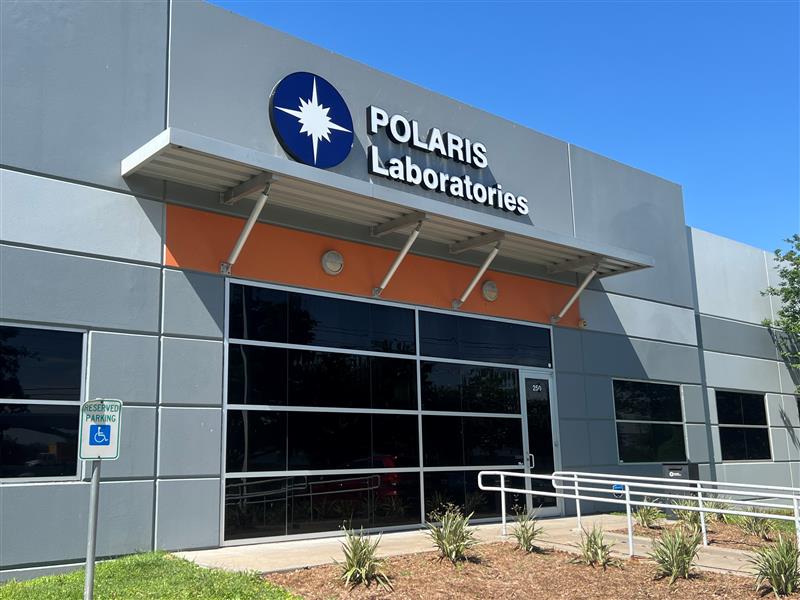
Our laboratory facility in Houston, Texas is moving to a larger space and opening March 25

As we continue to grow, we need additional space to develop and maintain our lean processes, expand our available laboratory testing services, and reduce our sample turnaround times – all in an effort to better serve our customers. As your dedicated fluid analysis laboratory, we will provide the same quality testing and results in this new location.

Customer can begin sending samples to the new laboratory starting March 18 – see new address below:

New Address
4100 N. Sam Houston Parkway W. Suite 250
Houston, TX 77086

Please note, that the new address is very similar to our old address, pay close attention to the North and West of the address.

Below are a few important things to note, along with significant dates:

  • No Service Interruptions – There will be no closures or delays in processing, testing and analyzing samples
  • Non-Houston Locations – Shipments to non-Houston laboratories will not be affected
  • Sample Labels – Product orders for sample information forms will display the new address starting March 1
  • Shipments to New Address – Customers can begin sending samples to the new address on March 18
  • Move Date – New laboratory location opens for processing and testing samples on March 25
  • Seamless Transition – Any samples sent to our previous Houston address will arrive at the new location seamlessly starting March 25

We thank you for choosing us as your fluid analysis laboratory and your partner on your journey to optimizing equipment reliability.

Published Monday, February 26, 2024, revised March 15, 2024

Analysis Keeps Compressor Components in Top Shape

Seeing Proven Savings: One Report at a Time

Fluid analysis is a powerful tool in the preventive maintenance toolbox of many equipment and maintenance managers in industries ranging from construction to aggregates to mining to marine. Efficiently managed programs provide considerable benefits that translate directly into maintenance cost savings for industries who rely on the operation of their equipment.

When operating equipment, it’s inevitable to see some wear as the machine operates overtime. One of the most valuable advantages of fluid analysis is detecting early signs of wear within equipment by analyzing wear particles within the oil.

Saving $80,000 in Engine Replacement Cost

One of POLARIS Laboratories® customers in the Marine industry was able to save the entire replacement of an engine by performing recommended actions on a high severity lubricant analysis sample report. After collecting an oil sample during a break in the oil change schedule, the company’s sample report returned at a high severity. The recommended maintenance action based on the test results and interpretation was to borescope the cylinders, in which the team observed scoring on the cylinder liners.

Report showing high levels of iron with a recommendation to check cylinders

While continuing to investigate the concern, it was observed that the bottom of the engine piston crown showed signs of deterioration. After discovering this, a strategic maintenance decision was made to replace all six pistons, liners and connecting rods.

As the company shares this story with POLARIS Laboratories®, it was noted that there were no other condition monitoring indications or alarms that showed there was an engine issue – the concern was only identified based on the test results and recommendations on the lubricant analysis sample report. Without the sample report indicating abnormal wear and suggestion to evaluate the cylinders, the problem would not have been identified and would have led to a total engine loss and $80,000.

Avoiding Lost Production, Downtime and $260,000+ in Engine Loss

For a POLARIS Laboratories® customer in the Aggregates industry, equipment downtime can be detrimental to production, customer satisfaction, labor costs and operations. The company had coolant analysis report came back indicating a high freeze point which, if not addressed, would have caused the engine block to freeze resulting in a complete engine replacement of $135,000 (this does not include the downtime if the asset was out of production for repairs).

In another instance, the company was able to avoid a full axle rebuild that would have cost $50,000 by addressing a simple issue and replacing the oil after a lubricant analysis report came back with results indicating a leak in the axle which had resulted in dirt contamination causing wear.

Report showing high levels of sodium with a recommendation to check cooling system for leaks

A very recent equipment save through oil analysis for the company involved receiving a report back that indicated high levels of lead. The team was able to proactively replace the NRS coolers before the engine could experience failure – a failure that would have cost the company $75,000 to repair, plus the additional downtime loss.

Fluid analysis is a proactive, preventive, predictive and cost-effective condition monitoring tool proven to minimize unexpected and un-budgeted maintenance costs by detecting signs of early wear and contamination. Through interpreting test results and maintenance recommendations provided by the data analysts, maintenance and equipment managers can take action before failure even has a chance.

Proven Impact. Proven Uptime. Proven Savings.

Let us prove it to you.

Published November 14, 2023