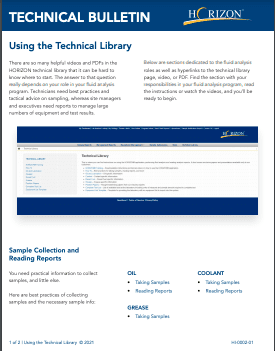
Go Digital with Your Condition Monitoring
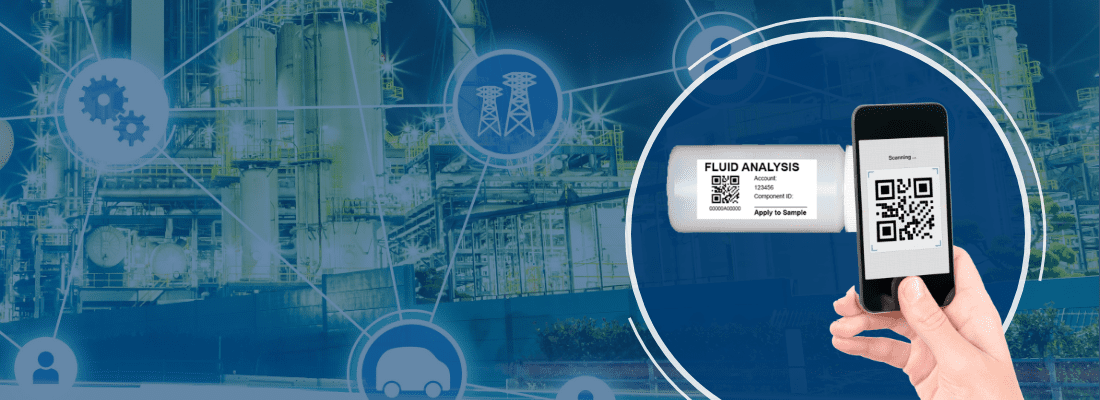
As the industry continues to grow in the digital landscape, POLARIS Laboratories® is always looking for ways to maximize customers’ access to technology. With tools such as Component ID Tags, QR-Code-Only Sample Labels and the HORIZON® mobile app, our customers can digitally customize how they manage their fluid analysis programs.
QR-Code Only Sample Labels
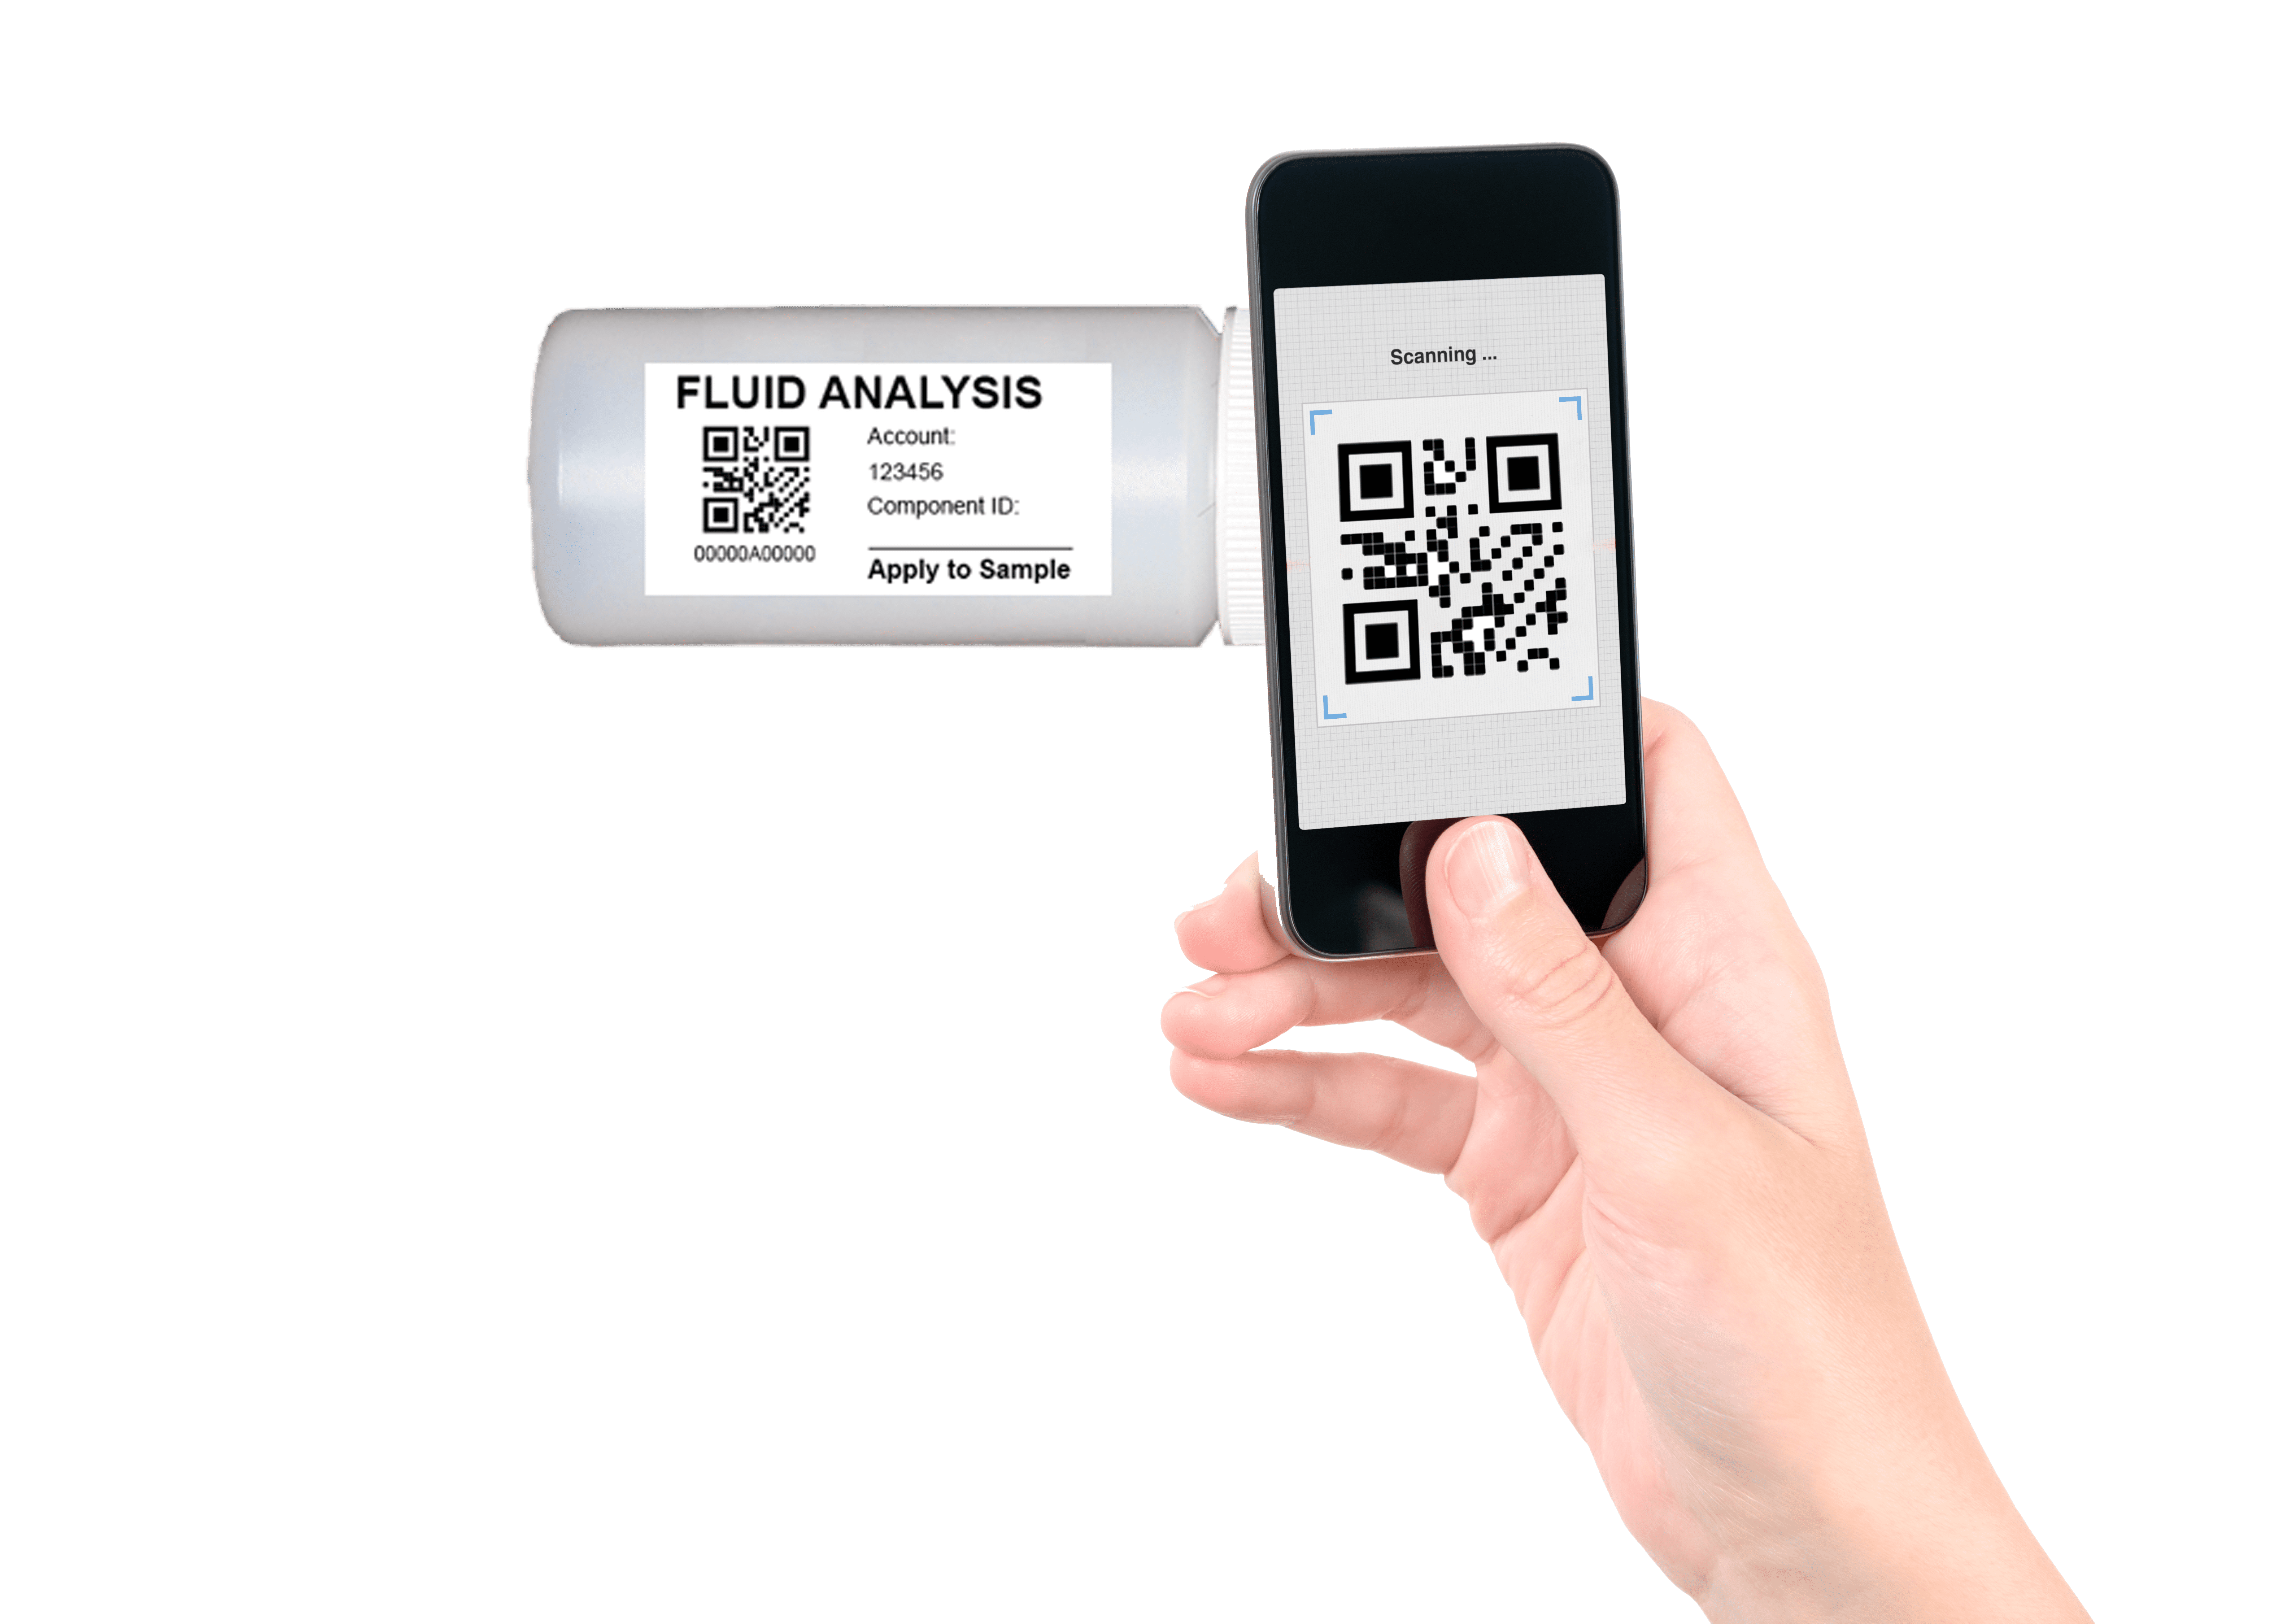
QR-Code Only Sample Labels contain a unique barcode number linked to a specific fluid sample, made to easily apply to the surface of the sample bottle. By transitioning to QR-Code Only Sample Labels, customers can reduce the costs of kits while simultaneously improving the overall carbon footprint.
Start using QR-Code Only Samples and:
- Eliminate handwritten submissions
- Minimize paper waste
- Accelerate result time
- Manage previous submission information
- Save on costs of kits
Read more on QR-Code Only Sample Labels
Streamline Submissions Through Component ID Tags
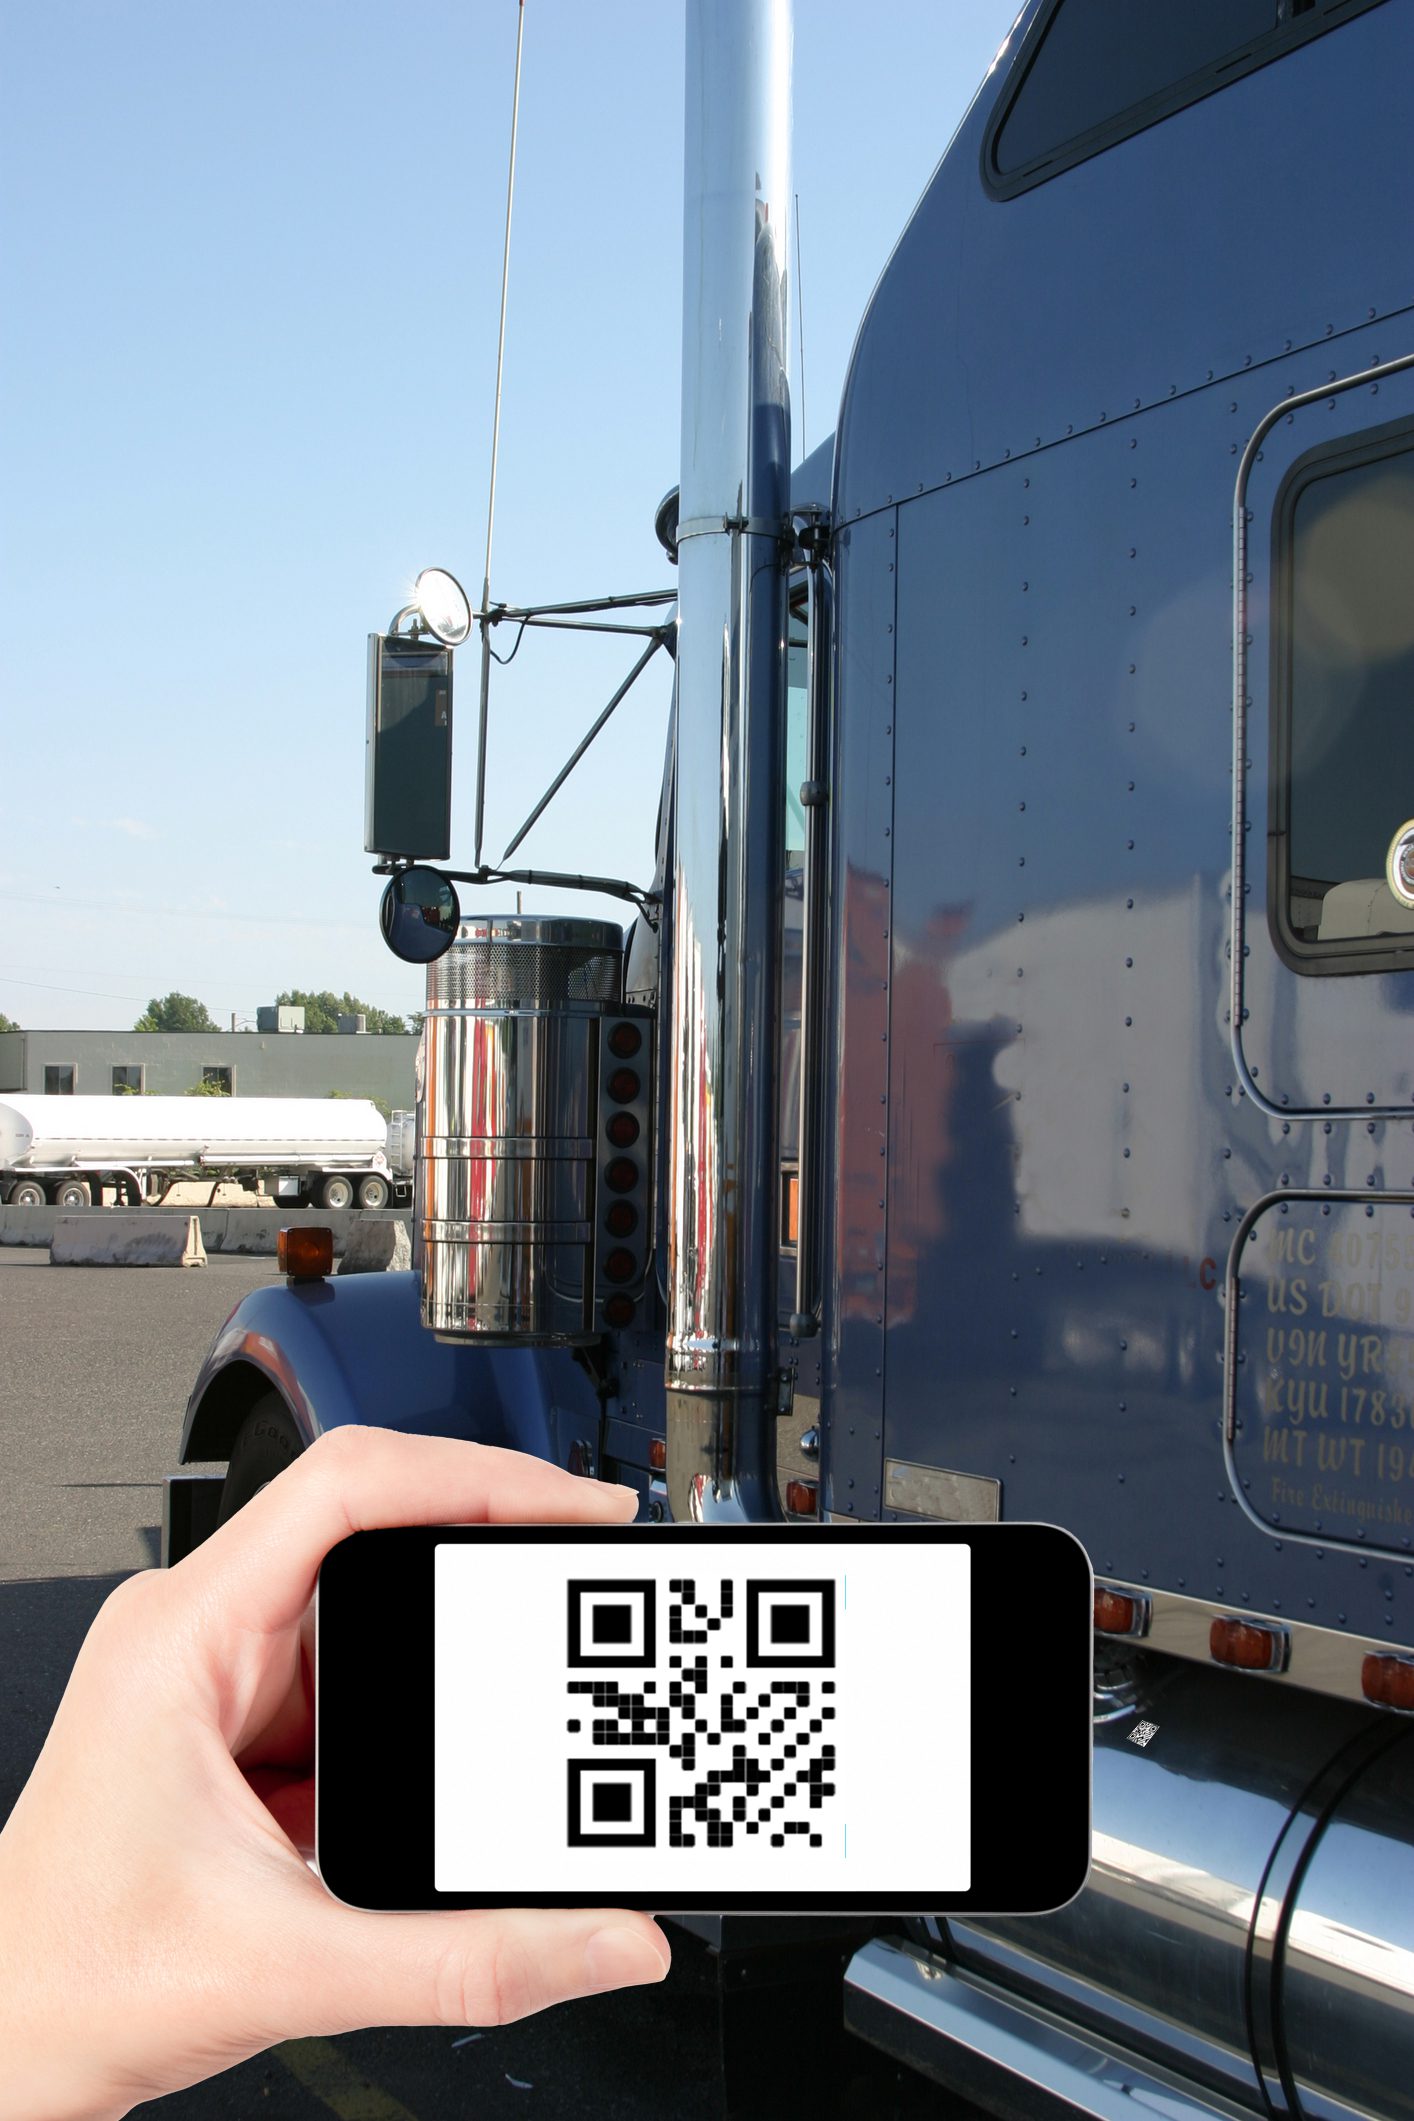
Registering equipment information has been made easier using Component ID Tags. Implementing the use of these QR tags minimizes time spent registering samples in HORIZON and ensures data accuracy.
Use Component ID QR Tags on equipment and:
- Eliminate manually entered ID’s
- Maintain component ID integrity
- Decrease registration steps
- Increase productivity
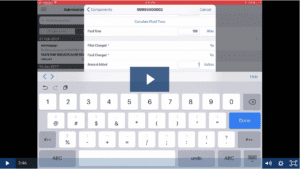
Get Connected Anywhere Through the HORIZON Mobile App

Implementing the use of QR codes works in tandem with the HORIZON mobile app. Customers can avoid paperwork and access fluid analysis data in HORIZON anywhere, anytime. The HORIZON mobile app gives customers unlimited access to view their equipment list, sample data history, view reports and more all within the reach of their pocket.
The mobile app allows customers to:
- Register samples
- Scan QR codes
- Receive and view reports
- Add and duplicate equipment
- Set up custom alerts based on report severity
The mobile app allows customers to edit fields including:
- Component ID
- Fluid type
- Component type
- Manufacturer
- Model
- Filter type
- Application
Stay Alert Anywhere You Go
Keeping up with the digital age and taking your fluid analysis program digital means quicker sample registration and faster response time to critical issues before they turn catastrophic.
POLARIS Laboratories® prioritizes our customers’ reliability through providing services that increase program efficiency. As we continue to innovate using technology to streamline our programs, we hope customers utilize these tools to effectively monitor their equipment.


 You’ve made the decision to use POLARIS Laboratories® as your trusted fluid analysis provider, a great start to a successful fluid analysis program. Now are using all the features available? POLARIS Laboratories® provides more than fluid analysis. Learn about how our convenient mobile app can help you manage your program in real time.