Oil Analysis: Why You Need it Now More than Ever

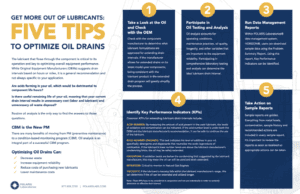
Today’s oil analysis capabilities offer a great deal more than just monitoring component health. With today’s technology, along with performing the proper tests, we can:

  • Monitor the condition of the oil
  • See the oil is suitable for continued use
  • Reduce the amount of used oil disposal
  • Adjust maintenance intervals and strategies
  • Adjust component replacement schedules
  • Improve forecasting and budgeting
  • Increase component life hours

Why Testing Now is Crucial

In today’s world, there’s another reason for oil analysis and why you need to do it now more than ever. Over the past many months, lubricants have been and continue to be in short supply. This is being caused by increased demand, additive shortages, logistics delays and a shortage of delivery drivers. Unfortunately, many companies are on allocation and only receiving partial amounts of their lubricant delivery. If you can’t get the lubricant supply you need, it might be a good time to look at how to get more out of the lubricant you already have.

Condition-Based Monitoring

Oil analysis is the tool to extending and optimizing drain intervals without compromising your equipment reliability. Many customers are still doing a preventive maintenance (PM) program, rather than a condition-based monitoring program. Often times, when a used oil sample is sent to the laboratory, the oil has already been disposed of. Now is the ideal time to look at moving to a condition-based monitoring program and let the laboratory’s data guide you on how much farther you can safely go with the lubricant you have in service. Ultimately, optimizing drain intervals reduces cost and waste, and helps lower maintenance costs when done correctly.

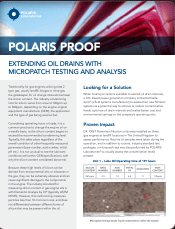
So, with finished lubricants in short supply right now, plus the ever increasing price of crude oil in today’s world (which ultimately raises the price of finished lubricants) one of your best options might be to consider extending your oil drains with “extended drain comments” from the data analysts and subject matter experts at POLARIS Laboratories®.  Please see below an example of a used oil analysis report with “extended drain comments”:

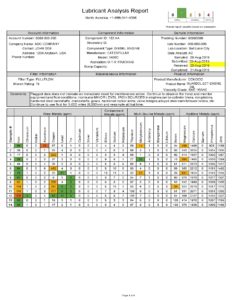
Click to View the Entire Report

Proven Impact. Proven Uptime. Proven Savings.
Let us prove it to you.

Published March 14, 2022

Tips to Confidently and Safely Extend Your Oil Drains

Short on lubricants? Lubricant supplier has your company on volume allocation?

Want to save on costs? Want to keep equipment running?

Look no further than the lubricants you have on hand.

Lubricants can be safely extended past the recommended oil drain. This requires testing of the lubricant to verify its physical properties and to evaluate its ability to continue properly protecting the equipment. A routine, consistent Fluid Analysis Program can determine any unusual wear pattern in the equipment, identify and control any contamination present and determine the suitability of the lubricant for continued use.

Therefore, if you follow the appropriate guidelines and participate in fluid analysis, you can squeeze a little more from your lubricants during these challenging times. For additional information on how to successfully achieve this, take a look at this infographic:

Five Tips to Optimize Oil Drains

If you would like additional information or assistance, please do not hesitate to contact POLARIS Laboratories®.

Proven Impact. Proven Uptime. Proven Savings.
Let us prove it to you.

Published February 15, 2022

Submit Daily Component Meter Readings with Your Samples

With POLARIS Laboratories® data integration solution, DataConnect, you can sync your sample data and submit samples through your CMMS. DataConnect now comes with a feature to sync daily component meter readings from your maintenance management system or telematics with your sample data.

Before this new functionality, POLARIS Laboratories® provided sample schedule reports in HORIZON® based on an assumption of the number of days it would take to reach your ‘sample due date’. Here’s an example: your last sample was performed at 2,000 hours and your sample interval is 500 hours, we would forecast, based on interval days that you provided, the date the next sample was due (sample interval 500 hours, equipment operated 8 hours per day, 5 days per week, number of days to reach 500 hours = 88 days, hours on component at last sample + 88 days = next sample date).

In a perfect world, this would suffice for optimal use of your maintenance data, but very few companies run equipment on a predefined number of hours per day. In reality, run time is dependent on many factors.

When you connect your data together through DataConnect and provide the laboratory with daily meter readings, we can forecast your next sample due date with much greater accuracy. Our team is working on additional functionality to send you alerts when your equipment is approaching the next sample due date based on these real-time meter readings.

We’re on the journey to help you achieve optimal equipment reliability – are you? Get started with DataConnect today.

Proven Impact. Proven Uptime. Proven Savings.
Let us prove it to you.

Published February 10, 2022

International Shipping Made Easy with POLARIS Laboratories® Europe

If the last two years have taught us anything, it is that shipping fluid analysis samples internationally has become more challenging. These challenges come from changing regulations around Brexit as well as COVID-19-related issues with sending and receiving shipments in these arduous times.

Solving these international shipping problems has been a key factor for POLARIS Laboratories in Europe. We strive to allow the seamless continuation of our customer’s analysis programs and the timely, cost-effective delivery of all samples to our laboratory located in Poznan, Poland.

Because our facility is located within the EU Economic Zone, this alleviates any Brexit-related customs issues and costs when shipping samples to a UK-based laboratory. Additionally, for any UK-based customers, we have a collection point located in the UK, which removes any complexities and additional costs for customers when using POLARIS Laboratories® for their fluid analysis programs.

What’s more, we also have strategically located sample collection points in Antwerp, Cologne and Istanbul – which allows customers located in these markets to send in samples locally. All our collection points utilize a global courier for next-working-day delivery of all samples from each collection point to the laboratory.

POLARIS Laboratories® offers larger customers the opportunity to utilize our own courier accounts, which further eases the complexity and costs associated with shipping samples to our laboratory.

Video: Fluid Analysis in Europe

When you switch to POLARIS Laboratories®, you save time and money – not only on shipping samples, but also on maintenance & reliability budgets as a whole.

Proven Impact. Proven Uptime. Proven Savings.
Let us prove it to you.

Published February 3, 2022

Case Study: Extending Oil Drains with Micropatch Testing

When looking at options available to extend oil drain intervals, a U.K.-based power generation company contacted Delta-Xero® (a fluid systems manufacturer) to assess their new filtration systems as a potential way to remove or reduce contamination levels, optimize oil drain intervals and realize better cost and environmental savings on the company’s operating units.

Download the case study below to see how the power generation customer utilized micropatch testing on their samples to better understand the condition of the oil, and with close monitoring and regular sampling, was able to extend the oil drain interval from a weekly change of around 150 hours, to an operating time of 650 hours on average. This has resulted in a significant decrease in the amount of oil changes required on each engine, as well as significant savings on the labor involved, and the associated disposal costs of the used oil from each change out.

Download the Case Study

Submit Samples Faster with QR Code Asset Tags

Any number of component ID’s registered on the HORIZON® platform can instantly be rendered into a QR code directly from your list of equipment. The QR codes can be conveniently printed and affixed near the sample point of the corresponding equipment with a tag or label. The component ID tag can then be scanned anytime with your smartphone while using the HORIZON mobile app. Whether registering a sample after collection or searching for the latest sample report, component ID tags effortlessly identify the asset’s sample point on-the-spot.

Here are just a few advantages of utilizing component ID QR code tags:

  • Completely eliminates the need to hand-enter ID’s
  • Decreases time locating equipment and increases operational efficiency and productivity
  • Streamline sample registration during maintenance intervals saving time
  • Instantly locate reports for a unit with signs of trouble
  • Maintain component ID integrity utilizing the same identifications system across your organization without the pollution of false IDs or risk when units move location
  • Integration with CMMS or 3rd party applications incorporating the same component ID
  • Easily able to scan even when damaged and can be manually read in a worst state scenario

Learn More about QR code tags

Avoid Delays and Ship Samples ASAP

Sample. Ship. Results. 

Taking into account the shipping issues and labor shortages affecting shipments in addition to the holidays fast approaching, it’s more important now than ever to ship your samples as soon as you can so they can make it to the laboratory for testing.

We know how vital your sample results are when faced with making tough maintenance decisions and we want to help you prepare to navigate this crazy time to eliminate your equipment’s downtime.

The good news is, we’re providing a few steps you can take now to help tackle today’s shipping problems we’re facing.

1. Pre-order Kits and Supplies

Place orders for sample kits now. Having a back stock of sample jars on hand for when equipment is scheduled for its upcoming preventive maintenance makes it simple and convenient to pull your samples. Don’t forget to add tubing, vacuum pumps, prepaid postage and valves to your cart!

Place Your Order Now

2. Implement a Shipping Strategy

Get those important samples taken and send them on their way to the closest laboratory as soon as you can (click here to see all of our locations). Timing is everything these days and, if you plan accordingly, you can avoid your package being delayed by this season’s holiday shipping surge. Also, be sure to utilize carriers who offer a trackable shipping service to our laboratory doors. This way you know when your package arrives for processing.


3. Communication

Team communication is very important as well this holiday season. Make sure your team is prepared to ship samples out to a laboratory location closest to them as soon as they can (click here for a guide on How to Ship Samples). In addition, make sure they know that they can purchase prepaid UPS labels on the online store when ordering kits. These pre-paid labels are perfect for a 10-pack of samples and are designed to reduce packaging preparation time so you can get your samples on their way to the laboratory.

While these are unprecedented times, POLARIS Laboratories® is continually looking for ways to save you time and money.

Proven Impact. Proven Uptime. Proven Savings.
Let us prove it to you.

How to Prepare Your Program for 2022

After the events of 2020 throwing operations out of whack, we had high hopes for 2021. Unfortunately, the maintenance industry continued to struggle – whether it be labor shortages or lubricant shortages. But, we’re here to give you a little hope for 2022. We’re here to help you get your maintenance program ready for a new year.

Here are some tips to regain control of your maintenance program:

  1. Take an inventory of your equipment and conditions
  2. Identify or reassess the importance (criticality) of each equipment in your processes
  3. Dust off and review maintenance records of each individual piece of equipment
  4. Identify specific needs for each piece of equipment

If fluid analysis is one tool you use to assess equipment conditions, then consider these:

  1. Collaborate with your Technical Business Consultant | Identify specific actions/activities that will enhance the impact of a well-managed fluid analysis program (our team’s contact info is listed below)
  2. Audit your Equipment List | Complete any missing information and move inactive equipment to a mothball account
  3. Review Your Users | Assess your list of active users and add new or remove those that are no longer needed
  4. Determine Training Needs | Identify gaps and schedule appropriate sessions and topics
  5. Develop and Participate in a Program Review | Program reviews highlight areas where the program is being successful, as well as those needing improvement. Specific equipment in need of attention can be identified as well.

If you are ready to refocus your maintenance and fluid analysis, contact your POLARIS Laboratories® Technical Business Consultant for assistance in reviewing your maintenance practices so you can take your fluid analysis program to the next level.

Proven Impact. Proven Uptime. Proven Savings.
Let us prove it to you.

Published October 19, 2021

When to Add Micropatch or Analytical Ferrography

Micropatch and Analytical Ferrography

Micropatch and Analytical Ferrography are typically performed after standard testing indicates a problem, meaning a problem warrants further investigation. These tests help data analysts study particle wear on machine components by visually analyzing the oil’s captured deposits. It may also be used to predict and diagnose equipment faults.

Catch What Oil Analysis Cannot

Ideally, mission-critical components should receive Micropatch or Analytical Ferrography testing on a regular basis to identify trends similar to standard oil analysis. Since these methods are qualitative and visual tests, an analyst may identify precursors to failure modes. This includes signs such as metallic spheres (which point to early signs of fatigue) or thermal discoloration (signs of excessive heat in localized areas), which would not be able be detectable in routine elemental analysis (ASTM D5185).

Signs to Add Micropatch or Analytical Ferrography

In summary, either test is a microscopic analysis of insoluble deposits in the sample, but both tests are not always appropriate. The Analytical Ferrography is recommended when a certain detection of iron is present from elemental analysis results or high ferrous density from particle quantifier testing. If the extrapolated limits identify an abnormal level, this test is used to determine wear mode (corrosive, fatigue, fretting, etc.) and condition severity based on the size, shape, and frequency of the respective deposits. The elemental analysis will only provide detection of particles sizing smaller than approximately ten microns. The microscope test will not discriminate captured wear metals with respect to the particle size, and enough iron will also cause non-ferrous metals and/or contaminants to deposit as well. The ferrogram’s glass slide may also heat-treat if certain wear metal deposits are unidentifiable. Alloys will experience a variety of thermal discoloration at a certain temperature based on the metallic composition, which provides allowance for improved recommendations.

The Micropatch is a suitable choice when elevated non-ferrous wear metals or external contamination are present in the absence of a significant iron detection. One of the greatest benefits of this test is the membrane patch will capture essentially all insoluble deposits in the oil. However, the level of contamination from other sources (dirt, soot, environmental contaminants, etc.) has the potential to sway an analyst from this recommendation versus the Analytical Ferrography. If too much contamination is present or expected to be present, particle stacking may occur, and significant information may be lost due to an inability for visual identification. The Analytical Ferrography testing has available techniques which may be able to avoid this issue during interpretation.


Analytical Ferrography and Micropatch Testing

Proven Impact. Proven Uptime. Proven Savings.
Let us prove it to you.

Published September 10, 2021

Why Accurate Sample Information is Important

Garbage In, Garbage Out

In this day and age, we have all encountered a situation where our personal data is not correct; it could be the bank has an old phone number or a store has a wrong or an old email address. POLARIS Laboratories® is no different when it comes to data – one area that hinders us and our laboratories is receiving accurate fluid information with your sample.

Why the Right Fluid Information is So Critical

It’s pretty simple really. If you send in a sample with incorrect fluid information, when we compare the test results from your sample to the information submitted, (the basis of a lot of the maintenance recommendations we make to you). If that information is correct, we are able to give you precise, actionable recommendations tailored to your application. If the information is incorrect, not only do the maintenance recommendations no longer hold as much value, but in some cases, we may recommend an incorrect action or repair.

To make matters worse, your test results may be delayed. For example, with the wrong fluid identified when submitted, we may send samples back to be retested in our laboratories to confirm, what looks like on paper, to be an incorrect result. This delays the results getting back to you. A more extreme example is submitting a used engine oil as an engine coolant, meaning the wrong test package may be applied, resulting in the sample going through the complete wrong testing thus missing issues you desperately need to be identified.

Blood Work as an Analogy

A good analogy for this would be getting getting blood taken at a doctor’s office. My blood, a middle-aged man, is submitted but the paperwork is mixed up. But because of the incorrect information, my blood is tested and the results compared to a 15 year old female – a very extreme case, but it could happen. My doctor gets the results back and then instructs me to go directly to hospital because my results say I’m in critical condition. The results from my blood are considered normal for a middle-aged male, but definitely abnormal for a 15-year old female.

Better Data = Better Predictions

It’s critical to a successful fluid analysis program that all applicable fields are filled in when submitting a sample. Testing in the laboratory is heavily dependent on the submission fields and directly affects whether or not a fluid receives the right laboratory testing and you recieve the right recommendations.

Proven Impact. Proven Uptime. Proven Savings.
Let us prove it to you.

Published August 11, 2021