Open the Valve to Data-Rich Samples

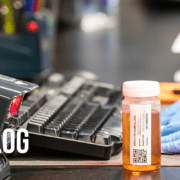
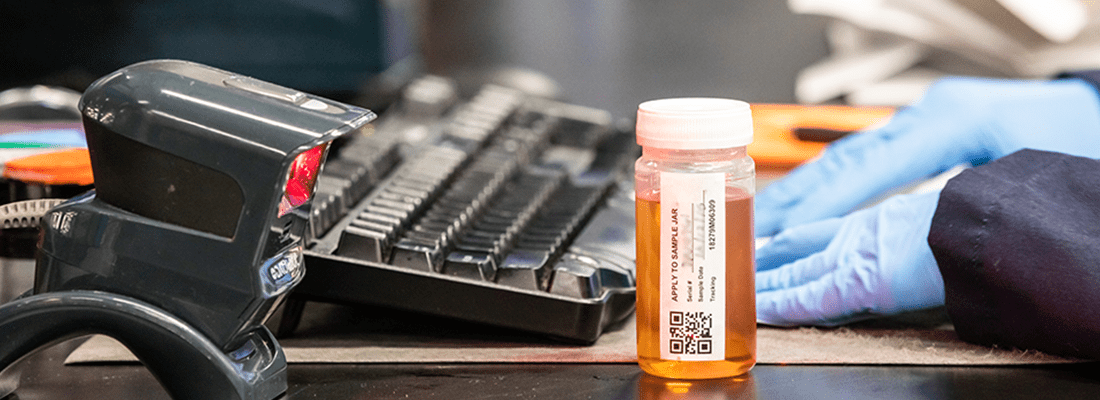
Regularly sampling the oil, coolant and diesel fuel circulating within your systems used for power generation is vital to ensure the smooth and efficient operation of these systems when they are required to be used, either for back-up or permanent power.
It’s All in the Sample
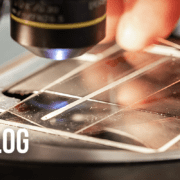
Taking regular, representative samples is critical to guaranteeing accurate, actionable fluid analysis test results are determined. This helps assess the condition of your fluids and if any maintenance is required to ensure uptime of the equipment when needed.
Want to Get an Accurate Sample Every Single Time AND Save 5 Minutes Per Sample?
Of course you do! Using sample ports and valves ensures that representative samples are taken from all systems, each and every time by confirming that the fluid extracted is representative of the bulk fluid circulating within the unit. As well as providing the ‘best sample possible’, using sample valves also significantly reduces the time and labour required when taking samples. Studies show that using sample valves instead of traditional vacuum pump and tubing method reduces the sample collection process by up to 5 minutes per system. Samples can also be taken safely whilst the equipment is running which further enhances the quality of the sample.
There’s a Valve for You
Valves can be retro-fitted to fit any system and we’re here to provide guidance on the optimum valve required for the component. In addition, we help determine the valve location for any system to ensure the best possible sample can be taken. POLARIS Laboratories® can also provide you with a valve ROI calculator to demonstrate the potential cost savings of installing and using valves for your fluid analysis program.
Make the switch today and benefit from opening the valve on labour cost savings and increases in data-rich samples.
Contact us to start installing sample valves on your equipment.

Proven Impact. Proven Uptime. Proven Savings.
Let us prove it to you.