
3 Ways to Achieve Program Success
 Oil analysis will not and should not replace good, everyday maintenance practices. If used properly, oil analysis becomes a valuable diagnostic tool that can reduce maintenance costs, increase productivity and boost company profits. When used in conjunction with diagnostic tools such as vibration analysis, ultra sound and thermography, oil analysis can detect a variety of problems before they become failures. This gives users the valuable time necessary to make decisive, well-informed maintenance decisions. But often times, this is easier said than done. I’ve outlined a few ways to help your program be successful and reach its full potential:
-
Set Realistic Goals
- Set productive, attainable goals by which you can measure the success of your program and examine your current maintenance program.
- What is your maintenance strategy and what, if anything, does it accomplish?
- How do you measure that accomplishment?
- Do you want to:
- Monitor the condition of the lubricant?
- Monitor the condition of the equipment?
- Monitor the condition of the lubricant and the equipment?
- Monitor system cleanliness?
- Monitor contamination and wear?
- Adopt a proactive maintenance strategy vs. a reactive one?
- Extend oil drain intervals?
- Reduce downtime?
- Prevent/reduce failures?
- Extend equipment life expectancy?
- Set productive, attainable goals by which you can measure the success of your program and examine your current maintenance program.
-
Set Realistic Expectations
- What would it mean to your company financially to reduce downtime by 20%? Extend drain intervals by 25%? Reduce failures by 15%? Increase equipment life by 10%? How much money could be saved by becoming proactive as opposed to reactive? Affect change in your everyday maintenance practices by performing minor maintenance as often as necessary to avoid failure and ALWAYS act immediately on critical samples.
-
Measure Your ROI
- Measuring the effectiveness of your oil analysis program can easily justify its cost, or ROI, to management. To do this: determine your savings in increased uptime, reductions in oil consumption, labor parts replacement and compare that to the cost of doing oil analysis. Seeing these savings can help determine if your program is successful.
Setting both realistic goals and expectations and then measuring your return on investment can help you determine if your program is maximized and functioning as it should, and allows you to re-evaluate those goals if necessary.
Proven Impact. Proven Uptime. Proven Savings.
Let us prove it to you.


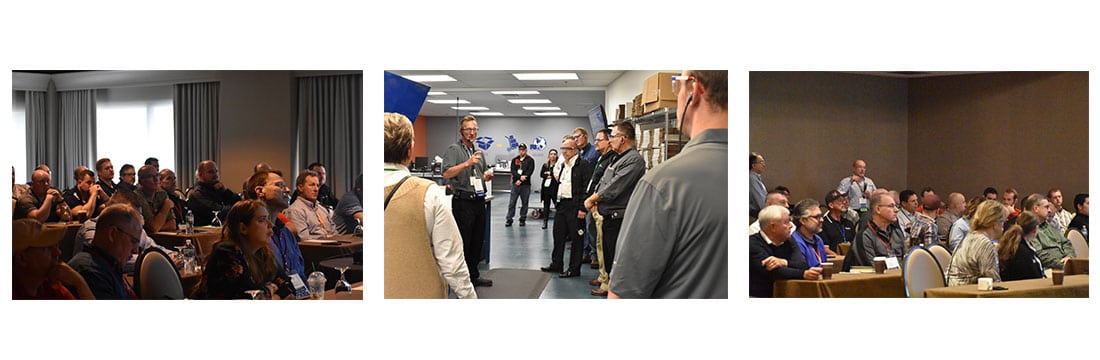
 POLARIS Laboratories® experienced succesful networking and visibility at the NORIA Reliable Plant Conference and Exhibition April 17-19. The conference welcomed hundreds of lubrication, oil analysis and maintenance professionals to Indianapolis. POLARIS Laboratories® was proud to be a premier sponsor of the event and provided many opportunities for attendees to network and learn about proven fluid analysis services.
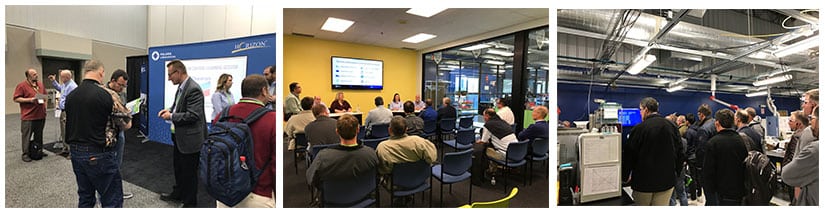

 “It’s not just fluid analysis, it’s what you do with it” is something we say a lot here at POLARIS Laboratories®. We strive to help our customers extend the life of their equipment – we do this through not only laboratory testing, but extensive data generation and analysis. While some consider us just “the laboratory”, we pride ourselves on being more than that. By providing you with in-depth analysis and maintenance recommendations, you can address any maintenance issues early.

 Building on past feedback from nearly 200 customers across more than 90 companies, the 2018 summit will provide greater variety and depth in the content we share. This is a must-attend for new and returning customers. Specific content will include new insights on:

 In the maintenance field, timing is everything. Often times, it can be the deciding factor whether or not equipment or machinery breaks down, causing jobs to be pushed back to later dates, effecting other business. What if you could eliminate fluid sample submission from being the cause of delays? POLARIS Laboratories® offers a convenient online sample submission option – which not only saves time, but results faster sample turnaround times, eliminates unnecessary timely delays and increases equipment uptime. So, why should you start submitting samples online?

 POLARIS Laboratories® constantly strives to meet our customers needs and expectations. Due to a high number of North American customers with locations throughout Europe, and with increasing shipping costs, in 2013 we decided to establish a laboratory facility in Europe to meet our customers needs on a global scale. This meant reduced shipping costs and much shorter turnaround time for samples for customers.