Advancements in Detecting and Measuring Soluble Varnish
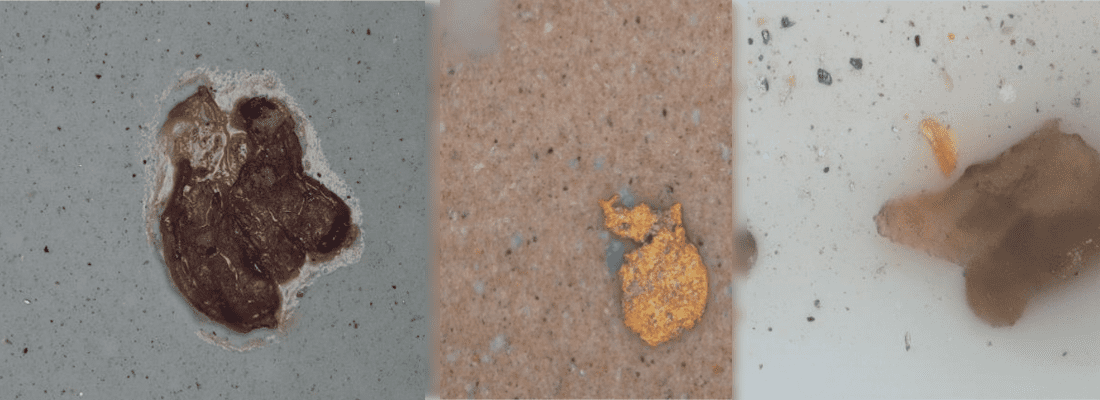
As part of our mission to improve the quality of our interpretation, POLARIS Laboratories® is constantly performing statistical analysis on our test results to evaluate typical parameters and establish thresholds for our tests. We are proud to announce improvements made to our new MPC method, which has the potential to measure soluble varnish in turbines, hydraulics and compressors using R&O formulations. This new method was introduced to our existing MPC method (ASTM D7843) as a tool for customers to more proactively identify and correct their oil’s potential to develop both soluble and insoluble varnish.

While our new method was introduced with the same severity range as ASTM D7843, we have now collected enough data to confidently establish new limits based on the same statistical methods used for other ASTM tests. Our findings show that the new method tends to produce higher values, and for this reason we will begin considering the results abnormal when they exceed a value of 25, whereas the threshold for the original method is 15.
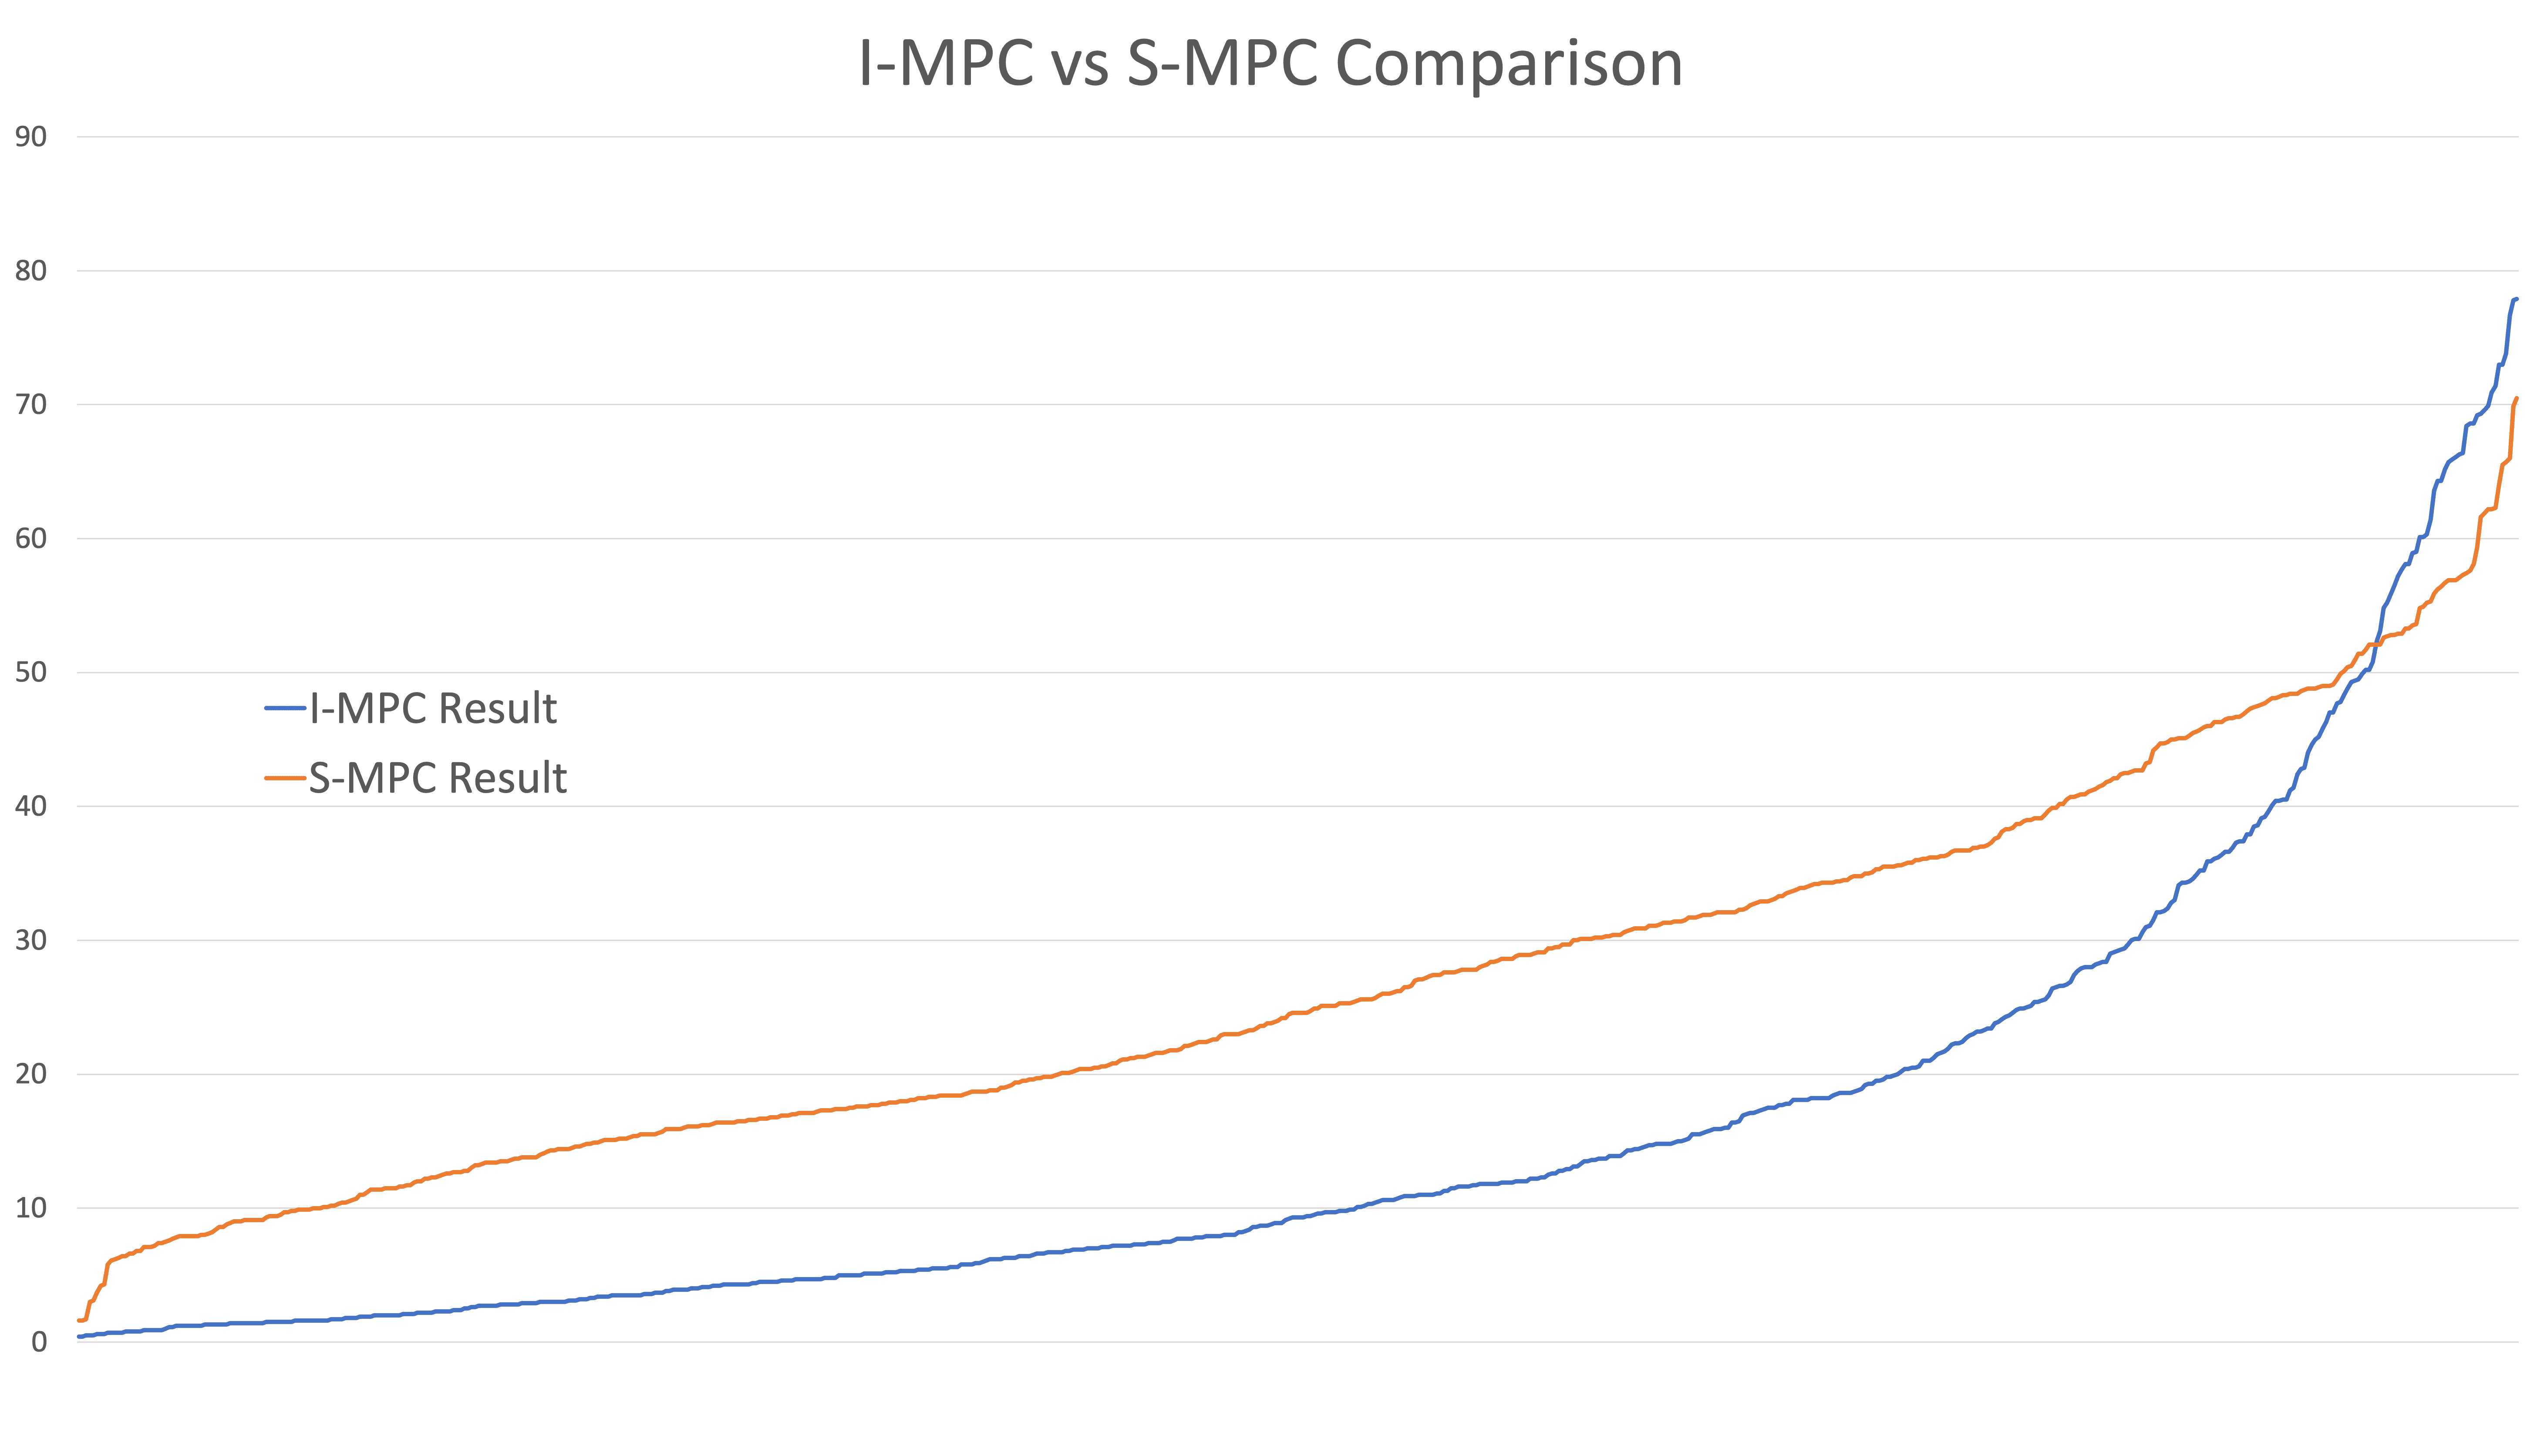
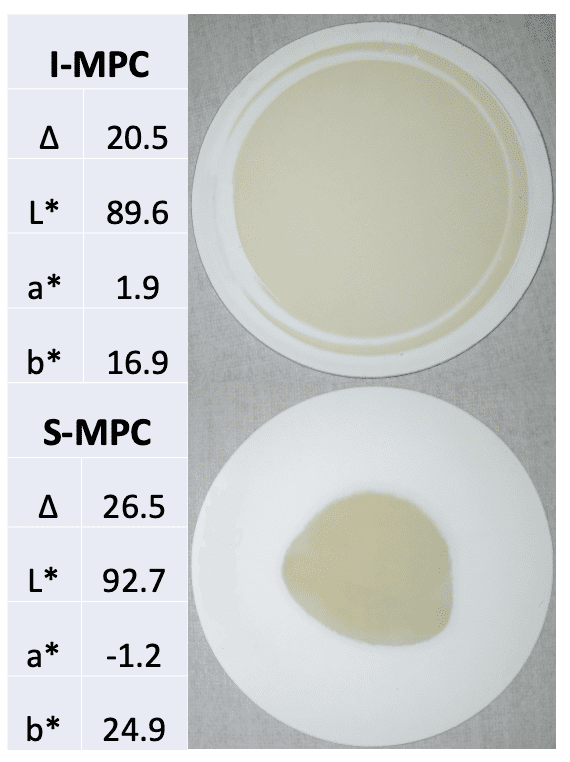
Along with our new MPC method, we also began reporting L*a*b* values to quantify color value. Our findings show that the L value (black to white) has a strong correlation with our original MPC method, and will now be considered “low” when the value is below 75. Similarly, our findings show that the b* value (yellow) has a strong correlation with the new MPC method, so this value will now be considered “high” when it exceeds a value of 35.

As with any other test that has been introduced, we are working to make improvements and understand factors that will influence the results. The new MPC method has the potential to measure soluble varnish, however there are many other variables that can influence the results. We will now start listing these variables on the report if the new MPC method is high, and will not recommend that any action be taken unless results for the original method are high as well.


POLARIS Laboratories® strives to continually improve our methods and interpretation of the analysis conducted on fluid samples to assist our customers catch varnish contamination sooner, saving more equipment and improving reliability.

Proven Impact. Proven Uptime. Proven Savings.

Let us prove it to you.

Published July 28, 2023

Value of Oil Analysis: Lubricant Manufacturers, Marketers and Distributors

Delivering value through oil analysis separates you from the competition, validates your claims, builds credibility, can help extend oil drains and leads to increased customer satisfaction. If you’re a lubricant marketer or distributor, here are a few values that come along with oil analysis, both for you and your customer.

Talking Oil Analysis: Where to Start

1. An efficient, well-managed oil analysis program is a daily reminder of the service and can help safely extend your drains.

2. Independent laboratory oil analysis validates your claims and builds credibility for your lubricant.

3. New equipment? Oil analysis can find manufacturing defects and maintains warranties that ultimately increase the equipment’s lifecycle.

4. Extending oil drains is a good thing: if a customer wants to extend their oil drains, they’ll either do it with you or someone else.

5. Did you know 40-50% of preventable engine failures can be attributed to the cooling system? Cooling systems have changed dramatically in the last 30 years, and coolants have transformed with them. OAT, HOAT and NAPS formulas have joined conventional coolants, and mixing them together can make both coolants less effective.

6. Identify areas for improved maintenance: finding dirt and water contamination from maintenance problems or poor lubrication storage gives you even more opportunities to help your customers.

7. As an independent laboratory, POLARIS Laboratories® provides all the data analysis and reports, giving you the ability to use fact-based decisions with your customers.

8. Maintaining your profits and providing additional value is always more profitable than dropping prices and hoping to increase volume.

Proven Impact. Proven Uptime. Proven Savings.

Let us prove it to you.

Published July 26, 2023

Revolutionized Maintenance Training at INTEGRATE

Where can you find education and training designed to give you the tools you need to see success along your reliability journey?

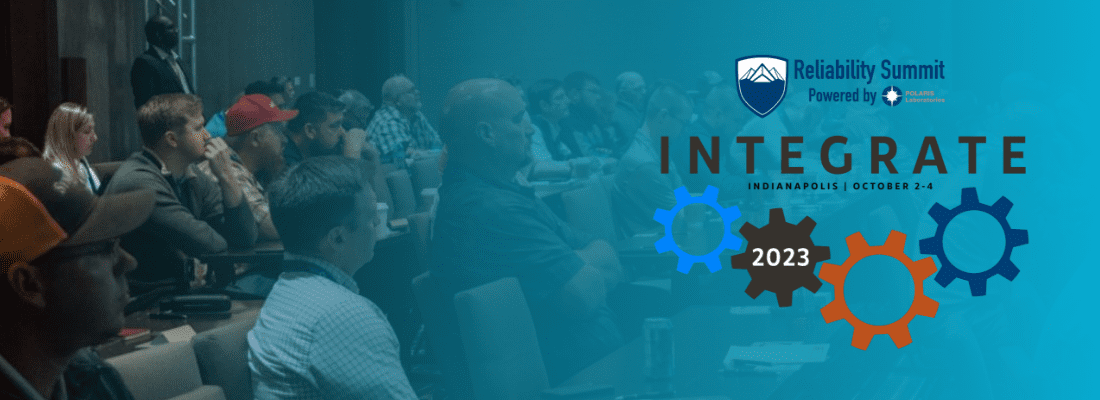
The answer: at the 2023 Reliability Summit | INTEGRATE. 

We’ve revolutionized our annual maintenance training conference to provide all-encompassing training on every aspect of your fluid analysis program. From expanding your use of the HORIZON® platform, to understanding how to grow your program, learning how sampling can be made easier, to increasing understanding of result interpretation, to eliminating silos by integrating fluid analysis data into your maintenance management system, INTEGRATE is the one place you need to be.

View this year’s line up of speakers and learning sessions

In one trip to Indianapolis in October, you and your maintenance teams can gain new ideas, insights and knowledge to kick your maintenance into high gear and see your reliability program reap the benefits of effective, impactful fluid analysis.

Gain New Perspectives

Not only will you gain education, but you’ll also gain new perspectives. During this 2-day exclusive event, hosted by POLARIS Laboratories® at The Alexander in Indianapolis, you’ll have the chance to:

  • Meet one-on-one with your account representative
  • Ask subject matter experts your questions
  • Learn what others are doing to improve their reliability program
  • Network with fellow maintenance professionals to learn and grow from their experiences

See Operations in Action

When you attend INTEGRATE, you get more than education through learning sessions, you get a first-hand look at not one, but two facilities through exclusive tours – and a chance to see inside POLARIS Laboratories’ headquarters laboratory in Indianapolis.

Cummins Augmented & Virtual Environmental Lab

Experience a tour of Cummins technical center and environmental lab and see what Cummins engineers and scientists are creating, testing and evaluating to prepare for the future of manufacturing. See processes and devices, including 3D printers, tomography x-ray systems and Cummins’ use of virtual reality.


U.S. Aggregates Facility & Mine Tour 

Get a glimpse of U.S Aggregates’ 460-acre facility and see a glimpse into their mining operations. See how U.S. Aggregates mines and processes limestone, while getting a first-hand look and feel of a raw material reduction with the use of explosives.


POLARIS Laboratories® 

This tour gives you a first-hand look inside our state-of-the art laboratory and headquarters facility in Indianapolis. From the time your sample hits the facility doors, to laboratory testing, to data analysis and customer support, and everything in between, this tour gives you an exclusive look into our laboratory daily operations.

These tours have limited spots, first come first served – register early if you want a seat on the tour. See the available tours and information here.

Discover New Solutions

Our annual training conference would not be possible without our event sponsors. We’ve teamed up with several industry solutions providers (lube manufacturers, filter solutions, sampling supplies, data integration) to give you tools to advance your programs and expand your maintenance practices. Each sponsor will have an exhibitor booth at the conference as well. Please feel free to stop by their booths to see what they have to offer your program!

It’s All Here in Indianapolis

I’ll leave you with this question, where else can you find lube manufacturers, OEMs, testing experts, reliability professionals, integration solution providers and everyone in between? At INTEGRATE October 2-4 in Indianapolis.

From the Data Analyst: How Sample Information Affects Limits and Analysis

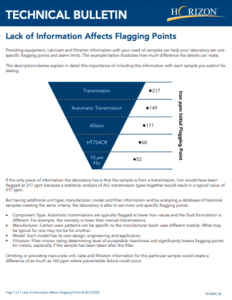
Two questions our Data Analysis team often receives from fluid analysis customers are “What information is necessary to analyze our samples?” and “Why is this information so important?”

Whether your sample is defined as a grease, diesel fuel, lubricant or coolant, there are complex interpretation factors accounted for each test result of the respective application. Aside from establishing the appropriate testing slate applied to a fluid, test limits may also vary and be comprised of SAE, ISO, POLARIS Laboratories®, OEM, industry charter and/or fluid manufacturer standards. Due to these reasons, it is imperative to supply as much relevant equipment and fluid information as accessible to your laboratory when submitting the sample for testing.

Here are a few scenarios… Without fluid information, a laboratory may not be able to see abnormal fluctuations for additive content or viscosity. The fluid’s basicity may become essentially depleted prior to detection, or the acidic levels may be too high for neutralization efforts. Without the specific equipment model, a laboratory may have to rely on generic data points to extrapolate typical wear accumulation. These limits may be too aggressive or not aggressive enough for the type of equipment tested. These are all exact scenarios we have previously experienced with customers.

For example, we may factor the following information when establishing statistical trends for wear metal content, lubricant properties and interpreted recommendations:

  • Equipment Type (e.g. engine)
  • Specific Application (e.g. diesel)
  • Equipment Manufacturer (e.g. Cummins)
  • Equipment Model (e.g. ISX)
  • Industry Type (e.g. logistics/transportation)
  • Lubricant Manufacturer (e.g. Chevron)
  • Lubricant Product (e.g. Delo 600 ADF)
  • Lubricant Viscosity (e.g. 15W40)
  • Filter Type (e.g. Full Flow)
  • Filter Micron Rating (e.g. 10 micron)
  • Sump Capacity (e.g. 14 gallon)
  • Time on Lubricant (e.g. 13,598 miles)
  • Time on Equipment (e.g. 124,600 miles)

While some equipment manufacturers have a ‘fixed’ wear limit table for operational guidelines, laboratories typically provide a more objective and literal statistical significance of normal wear accumulation. These statistics may reduce unnecessary calls for maintenance, which would otherwise lead to costly downtime or premature use of materials.

Read more in the Technical Bulletin

If you are unsure what information may be required to appropriately identify abnormal trends for your equipment samples, reach out to the laboratory for a list of the requisites and additional guidance. To receive an improved return on investment out of a lubricant, fuel, or coolant maintenance program, avoid delays or guesswork the laboratory may experience due to absent sample information.