Diesel Exhaust Fluid (DEF) Testing is Now Available

POLARIS Laboratories® is excited to offer our customers testing and analysis for Diesel Exhaust Fluid (DEF).

DEF, also known as AUS 32 and marketed as AdBlue, is a water and urea mixture that is non-toxic, colorless and non-flammable. The aqueous urea solution is comprised of 32.5% urea and 67.5% deionized water.

Testing for DEF will include:

  • Elemental analysis
  • Visual examination
  • % Urea
  • pH
  • Specific Conductance

Because DEF manufacturers perform specification testing following the ISO 22241 guidelines, POLARIS Laboratories® will not provide this testing.

Testing your DEF can identify concerns of contamination that can result in a decrease in engine performance capabilities. The above tests will provide a comprehensive check for contamination within the DEF in-service fluid. Including comprehensive testing will provide awareness and indicate actions required to maintain the engines’ proper performance.

As DEF is consumed by the engine, the fluid in the tank on the equipment will eventually be depleted and new fluid will be added. Addressing identified contamination concerns early will avoid potential future issues in the system.

Reach out to our team today to add DEF testing to your fluid analysis program.

Go Digital with Your Condition Monitoring

As the industry continues to grow in the digital landscape, POLARIS Laboratories® is always looking for ways to maximize customers’ access to technology. With tools such as Component ID Tags, QR-Code-Only Sample Labels and the HORIZON® mobile app, our customers can digitally customize how they manage their fluid analysis programs.

QR-Code Only Sample Labels

QR-Code Only Sample Labels contain a unique barcode number linked to a specific fluid sample, made to easily apply to the surface of the sample bottle. By transitioning to QR-Code Only Sample Labels, customers can reduce the costs of kits while simultaneously improving the overall carbon footprint.

Start using QR-Code Only Samples and:

  • Eliminate handwritten submissions
  • Minimize paper waste
  • Accelerate result time
  • Manage previous submission information
  • Save on costs of kits

Read more on QR-Code Only Sample Labels

Streamline Submissions Through Component ID Tags

Registering equipment information has been made easier using Component ID Tags. Implementing the use of these QR tags minimizes time spent registering samples in HORIZON and ensures data accuracy.

Use Component ID QR Tags on equipment and:

  • Eliminate manually entered ID’s
  • Maintain component ID integrity
  • Decrease registration steps
  • Increase productivity

Get Connected Anywhere Through the HORIZON Mobile App

Implementing the use of QR codes works in tandem with the HORIZON mobile app. Customers can avoid paperwork and access fluid analysis data in HORIZON anywhere, anytime. The HORIZON mobile app gives customers unlimited access to view their equipment list, sample data history, view reports and more all within the reach of their pocket.

The mobile app allows customers to:

  • Register samples
  • Scan QR codes
  • Receive and view reports
  • Add and duplicate equipment
  • Set up custom alerts based on report severity

The mobile app allows customers to edit fields including:

  • Component ID
  • Fluid type
  • Component type
  • Manufacturer
  • Model
  • Filter type
  • Application

Stay Alert Anywhere You Go

Keeping up with the digital age and taking your fluid analysis program digital means quicker sample registration and faster response time to critical issues before they turn catastrophic.

POLARIS Laboratories® prioritizes our customers’ reliability through providing services that increase program efficiency. As we continue to innovate using technology to streamline our programs, we hope customers utilize these tools to effectively monitor their equipment.

Seeing Proven Savings: One Report at a Time

Fluid analysis is a powerful tool in the preventive maintenance toolbox of many equipment and maintenance managers in industries ranging from construction to aggregates to mining to marine. Efficiently managed programs provide considerable benefits that translate directly into maintenance cost savings for industries who rely on the operation of their equipment.

When operating equipment, it’s inevitable to see some wear as the machine operates overtime. One of the most valuable advantages of fluid analysis is detecting early signs of wear within equipment by analyzing wear particles within the oil.

Saving $80,000 in Engine Replacement Cost

One of POLARIS Laboratories® customers in the Marine industry was able to save the entire replacement of an engine by performing recommended actions on a high severity lubricant analysis sample report. After collecting an oil sample during a break in the oil change schedule, the company’s sample report returned at a high severity. The recommended maintenance action based on the test results and interpretation was to borescope the cylinders, in which the team observed scoring on the cylinder liners.

Report showing high levels of iron with a recommendation to check cylinders

While continuing to investigate the concern, it was observed that the bottom of the engine piston crown showed signs of deterioration. After discovering this, a strategic maintenance decision was made to replace all six pistons, liners and connecting rods.

As the company shares this story with POLARIS Laboratories®, it was noted that there were no other condition monitoring indications or alarms that showed there was an engine issue – the concern was only identified based on the test results and recommendations on the lubricant analysis sample report. Without the sample report indicating abnormal wear and suggestion to evaluate the cylinders, the problem would not have been identified and would have led to a total engine loss and $80,000.

Avoiding Lost Production, Downtime and $260,000+ in Engine Loss

For a POLARIS Laboratories® customer in the Aggregates industry, equipment downtime can be detrimental to production, customer satisfaction, labor costs and operations. The company had coolant analysis report came back indicating a high freeze point which, if not addressed, would have caused the engine block to freeze resulting in a complete engine replacement of $135,000 (this does not include the downtime if the asset was out of production for repairs).

In another instance, the company was able to avoid a full axle rebuild that would have cost $50,000 by addressing a simple issue and replacing the oil after a lubricant analysis report came back with results indicating a leak in the axle which had resulted in dirt contamination causing wear.

Report showing high levels of sodium with a recommendation to check cooling system for leaks

A very recent equipment save through oil analysis for the company involved receiving a report back that indicated high levels of lead. The team was able to proactively replace the NRS coolers before the engine could experience failure – a failure that would have cost the company $75,000 to repair, plus the additional downtime loss.

Fluid analysis is a proactive, preventive, predictive and cost-effective condition monitoring tool proven to minimize unexpected and un-budgeted maintenance costs by detecting signs of early wear and contamination. Through interpreting test results and maintenance recommendations provided by the data analysts, maintenance and equipment managers can take action before failure even has a chance.

Proven Impact. Proven Uptime. Proven Savings.

Let us prove it to you.

Published November 14, 2023

Revolutionized Maintenance Training at INTEGRATE

Where can you find education and training designed to give you the tools you need to see success along your reliability journey?

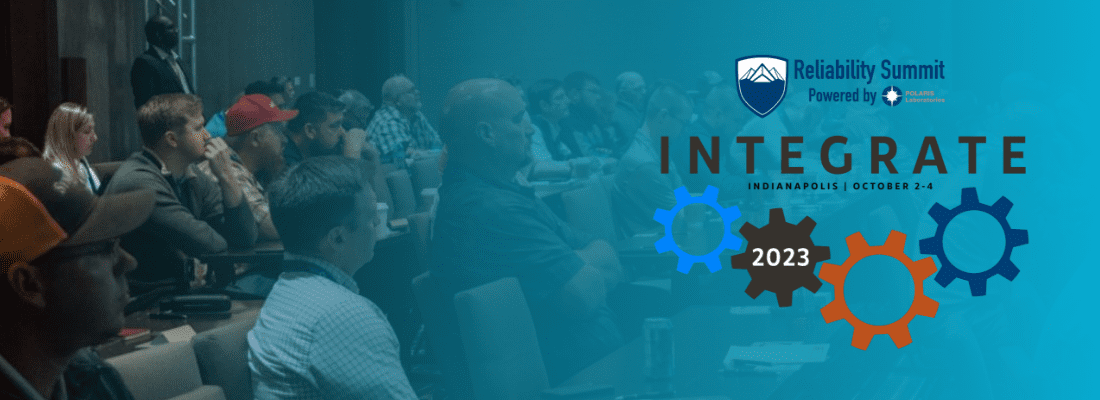
The answer: at the 2023 Reliability Summit | INTEGRATE. 

We’ve revolutionized our annual maintenance training conference to provide all-encompassing training on every aspect of your fluid analysis program. From expanding your use of the HORIZON® platform, to understanding how to grow your program, learning how sampling can be made easier, to increasing understanding of result interpretation, to eliminating silos by integrating fluid analysis data into your maintenance management system, INTEGRATE is the one place you need to be.

View this year’s line up of speakers and learning sessions

In one trip to Indianapolis in October, you and your maintenance teams can gain new ideas, insights and knowledge to kick your maintenance into high gear and see your reliability program reap the benefits of effective, impactful fluid analysis.

Gain New Perspectives

Not only will you gain education, but you’ll also gain new perspectives. During this 2-day exclusive event, hosted by POLARIS Laboratories® at The Alexander in Indianapolis, you’ll have the chance to:

  • Meet one-on-one with your account representative
  • Ask subject matter experts your questions
  • Learn what others are doing to improve their reliability program
  • Network with fellow maintenance professionals to learn and grow from their experiences

See Operations in Action

When you attend INTEGRATE, you get more than education through learning sessions, you get a first-hand look at not one, but two facilities through exclusive tours – and a chance to see inside POLARIS Laboratories’ headquarters laboratory in Indianapolis.

Cummins Augmented & Virtual Environmental Lab

Experience a tour of Cummins technical center and environmental lab and see what Cummins engineers and scientists are creating, testing and evaluating to prepare for the future of manufacturing. See processes and devices, including 3D printers, tomography x-ray systems and Cummins’ use of virtual reality.


U.S. Aggregates Facility & Mine Tour 

Get a glimpse of U.S Aggregates’ 460-acre facility and see a glimpse into their mining operations. See how U.S. Aggregates mines and processes limestone, while getting a first-hand look and feel of a raw material reduction with the use of explosives.


POLARIS Laboratories® 

This tour gives you a first-hand look inside our state-of-the art laboratory and headquarters facility in Indianapolis. From the time your sample hits the facility doors, to laboratory testing, to data analysis and customer support, and everything in between, this tour gives you an exclusive look into our laboratory daily operations.

These tours have limited spots, first come first served – register early if you want a seat on the tour. See the available tours and information here.

Discover New Solutions

Our annual training conference would not be possible without our event sponsors. We’ve teamed up with several industry solutions providers (lube manufacturers, filter solutions, sampling supplies, data integration) to give you tools to advance your programs and expand your maintenance practices. Each sponsor will have an exhibitor booth at the conference as well. Please feel free to stop by their booths to see what they have to offer your program!

It’s All Here in Indianapolis

I’ll leave you with this question, where else can you find lube manufacturers, OEMs, testing experts, reliability professionals, integration solution providers and everyone in between? At INTEGRATE October 2-4 in Indianapolis.

From the Data Analyst: How Sample Information Affects Limits and Analysis

Two questions our Data Analysis team often receives from fluid analysis customers are “What information is necessary to analyze our samples?” and “Why is this information so important?”

Whether your sample is defined as a grease, diesel fuel, lubricant or coolant, there are complex interpretation factors accounted for each test result of the respective application. Aside from establishing the appropriate testing slate applied to a fluid, test limits may also vary and be comprised of SAE, ISO, POLARIS Laboratories®, OEM, industry charter and/or fluid manufacturer standards. Due to these reasons, it is imperative to supply as much relevant equipment and fluid information as accessible to your laboratory when submitting the sample for testing.

Here are a few scenarios… Without fluid information, a laboratory may not be able to see abnormal fluctuations for additive content or viscosity. The fluid’s basicity may become essentially depleted prior to detection, or the acidic levels may be too high for neutralization efforts. Without the specific equipment model, a laboratory may have to rely on generic data points to extrapolate typical wear accumulation. These limits may be too aggressive or not aggressive enough for the type of equipment tested. These are all exact scenarios we have previously experienced with customers.

For example, we may factor the following information when establishing statistical trends for wear metal content, lubricant properties and interpreted recommendations:

  • Equipment Type (e.g. engine)
  • Specific Application (e.g. diesel)
  • Equipment Manufacturer (e.g. Cummins)
  • Equipment Model (e.g. ISX)
  • Industry Type (e.g. logistics/transportation)
  • Lubricant Manufacturer (e.g. Chevron)
  • Lubricant Product (e.g. Delo 600 ADF)
  • Lubricant Viscosity (e.g. 15W40)
  • Filter Type (e.g. Full Flow)
  • Filter Micron Rating (e.g. 10 micron)
  • Sump Capacity (e.g. 14 gallon)
  • Time on Lubricant (e.g. 13,598 miles)
  • Time on Equipment (e.g. 124,600 miles)

While some equipment manufacturers have a ‘fixed’ wear limit table for operational guidelines, laboratories typically provide a more objective and literal statistical significance of normal wear accumulation. These statistics may reduce unnecessary calls for maintenance, which would otherwise lead to costly downtime or premature use of materials.

Read more in the Technical Bulletin

If you are unsure what information may be required to appropriately identify abnormal trends for your equipment samples, reach out to the laboratory for a list of the requisites and additional guidance. To receive an improved return on investment out of a lubricant, fuel, or coolant maintenance program, avoid delays or guesswork the laboratory may experience due to absent sample information.

Diesel Fuel Analysis: Importance of Fuel Type

When submitting a diesel fuel sample for laboratory testing and analysis, it can be easy to assume that all diesel fuel is essentially the same and that it is not important to identify its grade. However, failure to do so can result in inaccurate test results and unnecessary alerts due to differences in the grades of the diesel fuel.

Distinguishing Diesel Fuel Types

According to ASTM D0975-22a, “Standard Specification for Diesel fuel,” the major types of diesel fuel are #1 and #2, with three grades each depending on the amount of sulfur present. Diesel fuel #2 the most common and is a general purpose fuel with a wide variety of applications. In the absence of special conditions, this is generally the most applicable fuel to use as it is cost-effective and offers better fuel mileage vs diesel fuel #1. Diesel fuel #1 is a special purpose fuel with a lower volatility that can withstand a lower temperature before gelling. This can be useful in lower temperatures and it can be used to make winter diesel blends.

In addition, both types of fuel are split into three grades each based on parts per million of sulfur content.

  1. S5000 (sometimes called high sulfur fuel) contains a maximum of 5000 ppm of sulfur
  2. S500 (sometimes called low sulfur fuel) contains a maximum of 500 ppm
  3. S15 (sometimes called ultra low sulfur fuel or ULSDF) contains a maximum of 15p pm of sulfur
    1. Learn more about verifying ppm specs in ultra low sulfur diesel fuel here

Differences in Diesel Fuel Testing

The differences between #1 and #2 diesel fuel can be seen in several laboratory tests. In particular, diesel fuel #1 will have lower results for Viscosity, Cloud Point, Pour Point and Distillation in relation to diesel fuel #2. Correctly identifying the fuel type will ensure that the analysis results are compared to the correct standards during analysis. This will help to determine if the fuel conforms to its specification, remove potential false alarms and ensure that the reported condition of the fuel is accurate.

Download our Complete Testing List here for more information on fuel testing offered by POLARIS Laboratories®

You can read more on the effects of ultra-low sulfur diesel fuel on viscosity in our Technical Bulletin here

Proven Impact. Proven Uptime. Proven Savings.

Let us prove it to you.

Published March 10, 2023

Sulfur Content in Diesel Fuel: Limits and Regulations

EPA Regulations and The Clean Air Act

Since the 1990s, diesel fuel quality has been an essential topic of discussion due to the increased regulations that the U.S. EPA has implemented over the years as a result of the Clean Air Act (CAA). One of the main goals of this Act was to set and achieve National Ambient Air Quality Standards (NAAQS) in every state. The 1990 CAA amendments were later revised to include the issuance of technology-based standards that require the maximum degree of reduction of emissions of hazardous air pollutants. New regulations meant engine manufacturers and diesel fuel producers would have to work together to determine how to meet the new standards best.

Effects of Emission Regulations on Diesel Fuel

The most easily attainable and regulated fuel property that the EPA regulated in the 90’s was sulfur content. Historically, ASTM standards have limited sulfur content to .5% (wt.). A few years later, in October 1993, a limit for Low Sulfur diesel fuel was introduced as 500 ppm = 0.05% (wt.) to facilitate the particulate sulfate reductions to meet the emissions standards.

Fast forward to June 2006, the maximum sulfur level in the U.S. was reduced to 15 ppm (Ultra Low Sulfur Diesel) for on road (highway) diesel engines and fuel supplies and was subsequently adopted by all nonroad, locomotive and marine (NRLM) diesel fuel and equipment in 2014. In addition, the regulations prompted engine manufacturers to deploy catalyst-based emission control devices, such as NOx absorbers and Diesel Particulate Filters (DPF), to meet new diesel emission tier standards.

Sulfur emission reduction has also been an important subject for the maritime industry. In 2010, marine standards that were previously exempt were further reduced from previous levels to 1,000 ppm within the Sulfur Emissions Control Areas (SECAs) for North America and the U.S. Caribbean Sea. In January 2020, new international rules put forth under the International Maritime Organization also reduced the global sulfur limit (outside SECAs) in marine fuels to 0.5% or 5000 ppm (down from 3.5%), and the change is expected to have a ripple effect throughout the fuel industry.

The U.S. Energy Information Administration (EIA) has noted that the change in sulfur limits has wide-ranging repercussions for the global refining and shipping industries, as well as petroleum supply, demand, trade flows and prices. From market disruptions from the COVID pandemic and today’s economic pressures on buying and selling bulk diesel fuel to meet demands, monitoring the sulfur content of your diesel fuel is still important decades after emission standards were implemented.

Reducing sulfur content in diesel fuel has placed a new demand on diesel engines and emission control systems in operation today. Factoring in the aging and foreign fuel supplies in circulation and storage, along with the ever-changing regulations means ensuring that equipment fuel supplies meet the required specifications is now necessary.

Check out our recommended testing for diesel fuels here.

Proven Impact. Proven Uptime. Proven Savings.
Let us prove it to you.

Published February 3, 2023

How to Ensure Optimum Performance of Wind Turbines

With the increase of greener energy production, wind turbines are playing an increasingly important role. It is vital that these energy producing turbines operate at optimum capacity for extended periods of time. To do this, a high level of equipment reliability is critical and, due to remote locations or access difficulties, all maintenance needs to be planned at optimum intervals to ensure maximum uptime and reductions in total cost of ownership (TCO).

The operating fluids inside a turbine, including lubricating oil in gearboxes and hydraulic systems, fluids used in cooling systems and greases all play a significant role in optimizing operation of the wind turbine. All of these operating fluids should be monitored closely to determine the condition of the fluid, identify contamination and measure the levels of wear metals generated within each system.

Monitoring conditions through routine fluid analysis allows you to avoid unplanned downtime and perform necessary maintenance based what is actually happening within the unit rather than on the hours in operation or calendar days. Planned, predictive maintenance will get you to optimum energy production.

See the recommended testing for power generation equipment here.

Proven Impact. Proven Uptime. Proven Savings.
Let us prove it to you.

Published January 5, 2023

ATP (Adenosine Triphosphate) Content Testing for Diesel Fuels

Do You Know What’s Happening in Your Diesel Fuel?

Ultra-low sulfur diesel and biodiesel fuel are particularly vulnerable to water contamination during transport and storage. Once water gets into the diesel fuel system, it creates the opportunity for an invasion of microorganisms. Microbes attack the fuel/water interface, where they thrive and multiply. Once established, they embed themselves in a thick layer of slimy deposits, creating several troublesome maintenance problems, including premature fuel filter plugging, clogged injectors, fuel storage tank corrosion, and leakage.

Proactively Detect Potential Microbial Activity

The new ATP (Adenosine Triphosphate) Content Test measures ATP, the primary component found in cells responsible for transferring energy in living organisms. An accurate measurement of ATP within diesel fuel provides a clear indication of when action should be taken to mitigate unwanted, harmful biological growth in the fuel system or tank.

With this new laboratory test, your sample’s results and analysis are are available faster compared to standard turnaround time for bacteria, fungi and mold testing included in basic diesel fuel test packages.

Click to View the ATP  Content Testing Technical Bulletin

If you’re interested in this new test, please reach out to your account manager or email service@eoilreports.com.

Proven Impact. Proven Uptime. Proven Savings.
Let us prove it to you.

Published December 8, 2022

Coming Soon: New Diesel Fuel Sample Bottle

In the coming months, customers who are testing diesel fuel will see a change in their diesel fuel test kits. The kits will include a smaller-sized metal sample bottle (a 500 mL rather than a 750 mL bottle). This new bottle can be used for collecting and sending in diesel fuel samples for all routine diesel fuel testing packages. Through recently implemented changes in diesel fuel testing procedures in the laboratory, the amount of diesel fuel required to perform testing has been reduced.

  • Smaller collection bottle means less diesel fuel from your machine
  • Reduction in the bottle size means lower shipping costs and less environmental waste
  • There will be no changes to test packages or kits, customers will begin to see the new bottle within newly ordered kits


If you have any questions, please reach out to our customer experience team at custserv@eoilreports.com or by phone 1.317.808.3750 (Monday – Friday, 7:30 a.m. – 7:00 p.m. ET)

Proven Impact. Proven Uptime. Proven Savings.
Let us prove it to you.

Published November 1, 2022