Sulfur Content in Diesel Fuel: Limits and Regulations

EPA Regulations and The Clean Air Act
Since the 1990s, diesel fuel quality has been an essential topic of discussion due to the increased regulations that the U.S. EPA has implemented over the years as a result of the Clean Air Act (CAA). One of the main goals of this Act was to set and achieve National Ambient Air Quality Standards (NAAQS) in every state. The 1990 CAA amendments were later revised to include the issuance of technology-based standards that require the maximum degree of reduction of emissions of hazardous air pollutants. New regulations meant engine manufacturers and diesel fuel producers would have to work together to determine how to meet the new standards best.
Effects of Emission Regulations on Diesel Fuel
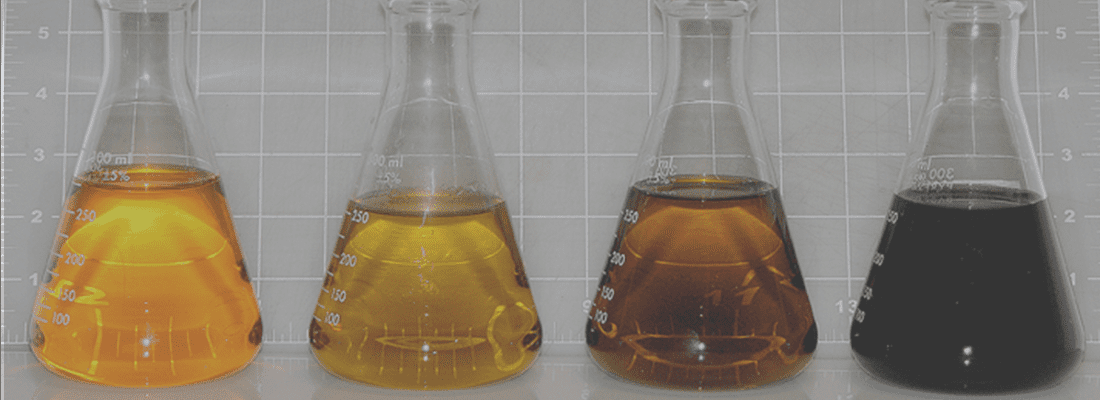
The most easily attainable and regulated fuel property that the EPA regulated in the 90’s was sulfur content. Historically, ASTM standards have limited sulfur content to .5% (wt.). A few years later, in October 1993, a limit for Low Sulfur diesel fuel was introduced as 500 ppm = 0.05% (wt.) to facilitate the particulate sulfate reductions to meet the emissions standards.
Fast forward to June 2006, the maximum sulfur level in the U.S. was reduced to 15 ppm (Ultra Low Sulfur Diesel) for on road (highway) diesel engines and fuel supplies and was subsequently adopted by all nonroad, locomotive and marine (NRLM) diesel fuel and equipment in 2014. In addition, the regulations prompted engine manufacturers to deploy catalyst-based emission control devices, such as NOx absorbers and Diesel Particulate Filters (DPF), to meet new diesel emission tier standards.
Sulfur emission reduction has also been an important subject for the maritime industry. In 2010, marine standards that were previously exempt were further reduced from previous levels to 1,000 ppm within the Sulfur Emissions Control Areas (SECAs) for North America and the U.S. Caribbean Sea. In January 2020, new international rules put forth under the International Maritime Organization also reduced the global sulfur limit (outside SECAs) in marine fuels to 0.5% or 5000 ppm (down from 3.5%), and the change is expected to have a ripple effect throughout the fuel industry.
The U.S. Energy Information Administration (EIA) has noted that the change in sulfur limits has wide-ranging repercussions for the global refining and shipping industries, as well as petroleum supply, demand, trade flows and prices. From market disruptions from the COVID pandemic and today’s economic pressures on buying and selling bulk diesel fuel to meet demands, monitoring the sulfur content of your diesel fuel is still important decades after emission standards were implemented.
Reducing sulfur content in diesel fuel has placed a new demand on diesel engines and emission control systems in operation today. Factoring in the aging and foreign fuel supplies in circulation and storage, along with the ever-changing regulations means ensuring that equipment fuel supplies meet the required specifications is now necessary.
Check out our recommended testing for diesel fuels here.

Proven Impact. Proven Uptime. Proven Savings.
Let us prove it to you.
Published February 3, 2023