Take Your Fluid Analysis On The Go

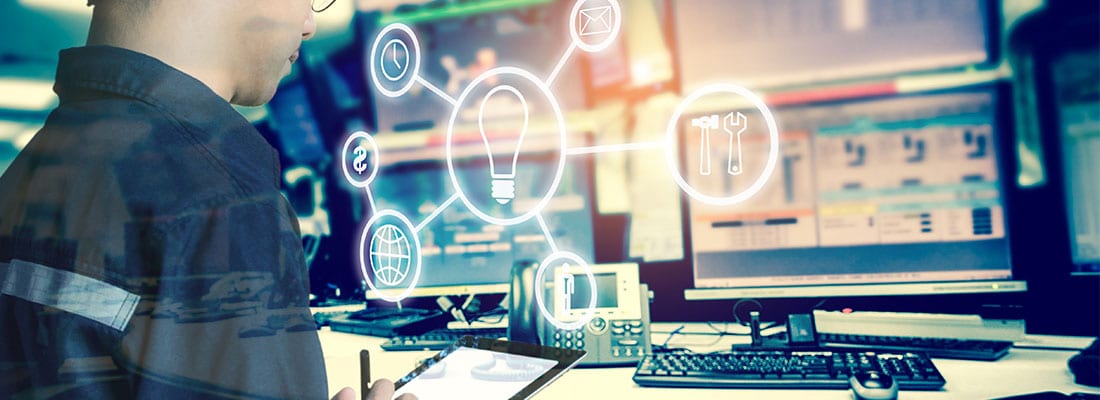
The need and desire for people to have access to information continues to be in demand for many industries – and predictive maintenance is one of them. Utilizing HORIZON®, POLARIS Laboratories® program and data management system, creates viable solutions for saving time and equipment. HORIZON can be accessed with personal computers and mobile devices, including tablets and smart phones.  The application is compatible with Apple and Android devices.

Take Your Fluid Analysis On The Go

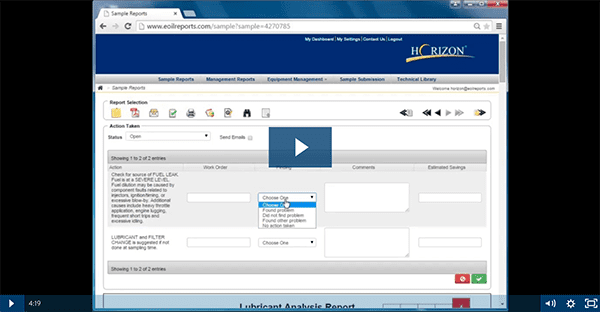
The features and benefits of HORIZON mobile allows you to perform fluid analysis-related tasks and manage your program in the field:

-Remotely submit sample information

-Utilize management reports

-Receive sample status alerts

-See faster total turnaround time (TAT) for sample results

-Quickly review previous sample reports and specific recommendations

The mobile application’s best benefit is the ability to submit sample information remotely. This can be performed while the user is performing routine maintenance and sampling – right at the component. This results in fewer errors and time savings. Submitting samples online also moves your sample to the front of the laboratory testing queue, expediting your turnaround time – getting you your results faster.

What’s New in the App

Download or update your app to experience the latest added feature: component transfer. The mobile app now

allows you to transfer components between pieces of equipment – letting you manage your

equipment faster and easier.


Going Mobile

From mobile banking to meal delivery to staying connected with your friends and peers, our lives are becoming more and more connected through mobile apps and devices – so it only makes sense to take your predictive maintenance program mobile, too. HORIZON mobile app can improve your ROI, lower your maintenance costs and it is a free service when you partner with POLARIS Laboratories® for your fluid analysis services.

Proven Impact. Proven Uptime. Proven Savings.
Let us prove it to you. 

Published  January 29, 2019


Equipment Reliability: How to Ensure Your Success

The Number One Objective

The American Society for Quality (ASQ) defines reliability as:

The probability that a product, system or service will perform its intended function adequately for a specified period of time, or will operate in a defined environment without failure.

Equipment reliability is the number one objective of any predictive maintenance program, but often times programs are started without completing the first, most important step – know the age and performance of the equipment you have.

Don’t Put the Cart Before the Horse

Often preventive maintenance programs are kicked off without having enough asset knowledge to be successful. As they say, “don’t put the cart before the horse.” Before you launch your program, it’s important to:

  1. Survey | Take inventory of all of mechanical components you own.
  2. Organize | Make sure that they are cataloged in a Computerized Maintenance Management System (CMMS) or other organized system.
  3. Rank | Put together a team to rank the criticality of the equipment.

Criticality rankings can be based on a number of different criteria. There is no one right way to do it, but the important thing to keep in mind when assessing criticality is risk – primarily safety, quality, and cost. For example, at POLARIS Laboratories®, we have a preventive maintenance schedule for all of our laboratory instruments, but if our air circulation system experiences downtime then none of those instruments can be operated. It’s a piece of equipment that is often taken for granted, but the risk associated with any downtime is catastrophic and impacts safety and cost.

Once you know what equipment you have and how critical it is to operations, then you can start to assess your fluid analysis program and other predictive tools.

Are you getting the right testing?

If the cost of failure for a specific asset is high, it might be worthwhile to pay for more advanced testing or do analytical ferrography routinely. If the cost is low, you may be able to reduce the sample frequency of some of your equipment. We often talk about preventive maintenance optimization – talk to POLARIS Laboratories® about how we can help you optimize your predictive maintenance intervals.

Proven Impact. Proven Uptime. Proven Savings.
Let us prove it to you. 

Published  January 22, 2019

Making a Difference in the Transportation Industry

There are numerous elements that go into a fluid analysis program achieving operational efficiency and program success. For the transportation industry, that could be compliance with consistent sampling, seeing the return on investment, saving on fleet maintenance costs or gaining buy-in from leadership. But, what really makes the difference for a transportation company when participating in a fluid analysis program is a program champion. A transportation company could have anywhere from just one single maintenance facility handling all samples, to more than 100 locations. The program champion provides effective communication, ownership and consistency – all affecting the success of the program.

Communication | managing all shop or facility managers can be time consuming – the program champion makes certain that any updates, changes, etc. are communicated properly to the appropriate people.

Ownership | having one individual own the fluid analysis program helps the program stay compliant

Consistency | the program champion ensures everyone is on the same page and is meeting compliance goals

A program champion who communicates effectively, owns the fluid analysis program and consistently checks in to see if the team is meeting their compliance goals, will lead their teams to the ultimate goal: success of the fluid analysis program.

What does it take to be a program champion? Check out our checklist:


Proven Impact. Proven Uptime. Proven Savings.
Let us prove it to you. 

Published  January 15, 2019

Dirty Dozen: 12 Types of Contamination


The life of components in automotive, industrial and other equipment is reduced when contaminants circulate through their systems. Water, solid particles, varnish and even air can lead to a decrease in drain intervals and an increase in foaming, oxidation, sludge and varnish formation—potentially causing serious damage and catastrophic failure.

What’s causing damage? Below are the four main categories of contamination:
  1. Air Contamination
    • Air causes foam to form and it may be a sign that the antifoam additive may be depleted and the oil needs to be changed out. Air causes the oil to look cloudy – often mistaking it for water contamination.
    • An easy way to visually tell the difference between air and water contamination: take a small oil sample in a clear container and allow it to sit undisturbed for 24 hours – air will rise to the top while water will settle to the bottom.
  2. Water Contamination
    • Water can get into your system through vapor in the air – but it can also come form rain, splashing, leaking fittings or power washing the equipment.
    • Measuring the current moisture level in your equipment’s oil, and then finding ways to reduce the moisture level, can significantly extend your machine’s life.
  3. Particle Contamination
    • Particle contamination can be caused by particles entering the system via air movement or oil degradation.
    • Here are some powerful facts for you:
      • Greater than 80 percent of machine wear is caused by particle contamination.
      • The industry spends upwards of $200 billion annually filtering fluids to prevent mechanical problems caused by hard particles.
  4. Varnish Contamination
    • Varnish buildup, whether it be hard or soft, can occur in reservoirs and throughout lube and hydraulic systems on components and filter elements. Once varnish formation begins, the equipment becomes unreliable and potentially unsafe.

Discover all 12 types of oil contamination, by reading my featured article in Lubes ‘N’ Greases’ October 2018 edition: Dirty Dozen: 12 Types of Oil Contamination by clicking below.


Proven Impact. Proven Uptime. Proven Savings.
Let us prove it to you. 

Published November 27, 2018

Preparing Your Program for 2019

How do you not only discover, but maximize the services and benefits by partnering with a fluid analysis laboratory and ensure it’s a positive addition to your preventive maintenance program? If your organization is partnering with a fluid analysis laboratory, it is important to examine what value-add services they offer and what you are actually paying for.

  • What software applications (technology) they offer?
  • What test packages are available?
  • What training services are offered?
  • Do they have industry accreditations?
  • Is there accessibility to communicating to relevant service personnel?

Having support from a trusted laboratory partner can help maximize these services and at the same time, educate members your maintenance team to utilize the available resources. At the end of day, you want to maximize the return on your investment which means your equipment’s of fluid’s life.

Steps to a Successful Program

A successful preventive maintenance program requires the following:

  1. Leadership | We call this a Program Champion. A Program Champion is preventive maintenance professional who provides buy-in about the wellbeing of their equipment – while providing leadership and accountability for a successful program.
  2. Goals | Establish realistic goals and an organized plan on how to achieve them in a timely manner.
  3. Education | Train your maintenance team on what is to be expected and what results need to achieved.
  4. Testing Capabilities | Access to the available test packages – and knowing what packages you need – will benefit your maintenance program.
Regular Routine

After your program is established – you need to maintain it.

  • Continuous Training | Have scheduled conversations with key members of your maintenance team and use the information or resources the laboratory has available.
  • Transparency | Ask for input from your maintenance team – this will generate interest in the program and foster an atmosphere for everyone to contribute and succeed.
  • Celebrate | Share your success stories and celebrate wins with your team.
  • Utilize Resources | If you have additional questions, contact a representative from your fluid analysis provider and remember this is one of the value-add services available to you.
Positive Program Standards for 2019

When you start planning for 2019, it’s important to re-evaluate and establish your program goals, provide continuous training, ensure you have all the requirements for a successful program and are utilize the value-add services available to you. By working together with your maintenance team, upper management and your fluid analysis provider – your program will succeed. Utilize this practice with other service providers who are components of your preventive maintenance program moving forward in the new year.


Proven Impact. Proven Uptime. Proven Savings.
Let us prove it to you.

Published November 13, 2018

HORIZON Mobile Update Release

What’s New

After seeing a high demand of customer requests to add this feature, we’ve released an update to the mobile application that will put more power into your mobile app. The app update allows you to edit your equipment – you can now add, duplicate and edit components in equipment management in the HORIZON mobile app.

The Power is in Your Fingertips

Update your mobile app today to experience the convenience of editing your equipment – right from your fingertips. You now have the power to:

  • Add new components
  • Duplicate existing components
  • Edit fields including:
    • Component ID
    • Fluid type
    • Component type
    • Manufacturer
    • Model
    • Filter type
    • Application
    • And more

Empower your fluid analysis, leverage the mobile app capabilities and maximize your fluid analysis program by downloading the latest version of the HORIZON Mobile app in the App Store or Google Play Store.

Work smarter, not harder

Additional real-time features of the HORIZON Mobile App include:

  • Sample Submission
  • Custom notification and alerts
  • View all sample reports
  • Sync with HORIZON web application
  • Sort and manage reports


Proven Impact. Proven Uptime. Proven Savings.
Let us prove it to you. 

Published November 6, 2018

Fluid Analysis: Cost vs. Price

Customers and potential customers often ask “what is the cost per sample?” This information is important for purchasing and supply chain reasons, but what is even more important is the savings a well-managed fluid analysis program can bring to any organization. Organizations that associate items with only cost will have little or no Return on Investment (ROI) – whereas those utilizing a complete fluid analysis program with value-added services can see an average ROI of 20:1, with some experiencing levels as high as 45:1.

Where Can You Save More?

Many fluid analysis program decisions are based solely on cost or price per sample as the major factor used to decide a supplier. What is often not considered are some of the unknown costs associated with a fluid analysis program. These include:

  • Day-to-day operational coordination to manage the program
  • Chance of incorrect or inefficient reporting
  • Manual, traditional, handwritten sample submission

It’s important to know these additional costs, how to leverage available solutions and maximize your ROI. Traditional handwritten submission forms can take up to five more minutes than submitting your sample online for via the mobile app or automated submissions from CMMS systems (check out DataConnect).

Take Advantage of Value-Add Services

True savings can only be measured by monitoring the efficiencies that your fluid analysis provider can offer you in your maintenance and reliability programs, and the services they provide integrate and enhance your strategies. POLARIS Laboratories® offers many value-add services included in the sample price – to help you decrease your operational costs.

  • Documented, transparent turnaround time
  • Sample status notifications and online tracking
  • Mobile app and online sample submission
  • CMMS integration (DataConnect)
  • Certified, experienced data analysis team
  • Automated, customizable data management reports
  • Hierarchical report structure and asset watch


Proven Impact. Proven Uptime. Proven Savings.
Let us prove it to you. 

Published October 30. 2018

VIDEO: How to Bridge the Gap with Filter Debris Analysis

Oil filters are designed to remove contaminants and particles that would have otherwise damaged the system – but did you know this also removes the evidence that data analysts can use to provide in-depth maintenance recommendations? Dive deeper into the particles, contamination and evidence of wear that are caught in the oil filter by sending in your oil filter for Filter Debris Analysis.

FDA Dives Deeper Into Contamination Causes

Standard oil analysis (Elemental Analysis by ICP) can provide you with information on what’s going on in your equipment – but, there are limits to what ICP can detect. ICP can only detect fine particles of approximately 10 microns or smaller – leaving larger particles unidentified. Filter Debris Analysis helps identify larger wear particle debris as well as outside contamination. The wear morphology, metal type(s) and contamination types can be identified to help determine the possible source of the wear or contamination.

How is FDA Performed?

The FDA process involves flushing the filter, extracting the particles and performing several tests (including micropatch and analytical ferrography) to identify wear particles. Check out the video below to see how we perform Filter Debris Analysis at POLARIS Laboratories®:

Learn more about Filter Debris Analysis by reading our technical bulletin.

Interested in adding FDA to your current fluid analysis program? Contact customer service or your account manager.

Proven Impact. Proven Uptime. Proven Savings.
Let us prove it to you.

Published October 9, 2018

The Future of Your Reliability

We live in a connected world

Do you find that your critical condition monitoring information (fluid analysis, thermography, acoustics, telematics, etc.) is stored and managed in many different places and systems? Do you have to manually connect each of these data points to come to conclusions? Companies like yours have to navigate through data and information that is too often siloed – creating unnecessary work, time and expense.

So, how do we eliminate these silos? How do we integrate data into one place and automate our reliability?

Imagine your machine creating a work order from the oil analysis results you received from the laboratory … but seamlessly, without the human connection. That’s the future of reliability – technology, integration, connections and removing the human connection.

Telematics. Artificial Intelligence. Machine Learning.

This prescriptive approach enables maintenance professionals to leverage the Industrial Internet of Things (IIoT) by integrating siloed data into a centralized digital system.

Leveraging fluid analysis information is the key to your success today, but establishing an asset reliability model for your organization of the future is paramount. And, if executed effectively, you will establish a truly empowered user experience that will save your company countless hours and effort in manual labor and analysis. And, it will improve your impact, uptime and savings. This is the future of maintenance and reliability, but you can take your first steps today.

So, where do you start?

POLARIS Laboratories’ DataConnect feature offers advanced data integration to seamlessly connect your CMMS to HORIZON®, our award-winning online management platform. This capability does the work for you by automatically importing your HORIZON sample data into your CMMS system.

The future of operational efficiency through integration, technology and advanced systems is here. Are you ready? Talk with one of our account managers or technical business consultants to turn today’s missed opportunity into tomorrow’s success story.

Proven Impact. Proven Uptime. Proven Savings.
Let us prove it to you.

Published October 2, 2018

Take Action & See the Savings

Have You Taken Action?

One of the most under-used and yet, most powerful tools that POLARIS Laboratories® data management system, HORIZON®, can provide our customers with the Action Taken function. Dive deeper into your sample data and recommendations and be able to:

  • Complete a work order from the recommended action item from the sample
  • Learn if you did or did not locate a problem in your equipment
  • Provide comments back to the laboratory based on your findings
  • Customize your results by narrowing down by date, severity or fluid type
  • Put in an estimated savings if you did find a problem

Run the Report an See Proven Savings

Want to see how much you’ve saved? Once you have completed action taken items you can run the Action Taken Summary Report out of HORIZON®. This report provides you with a summary of the actions that have been taken and allows you to spot trends and commonalities in issues you may be seeing, as well as provide you with total estimated savings that can prove the savings of your program. To learn more about how this report is run out of HORIZON, watch the how-to video below:

If you would like to see a demonstration of this tool, please reach out to your Account Manager.


Proven Impact. Proven Uptime. Proven Savings.
Let us prove it to you.

Published September 18, 2018