A Program Snapshot: HORIZON® Management Reports for Lube Marketers
The HORIZON data management system is robust in all that it can provide to a fluid analysis program. Team training is conducted on features like the Dashboard, Reading a Sample Report, Equipment List Management, Mobile App and Sample Submission – which are all important for program success. But, one feature of HORIZON that is often underutilized or undertrained is Management Reports. These reports provide lube marketers and program champions an overview of their fluid analysis program and provides specific areas for improvement.
There are twelve management report options in HORIZON. This means you can view twelve different sets of data in different areas of your program. For lubricant marketers specifically, the information provided in these reports can provide a look at how distributors and end users are utilizing their fluid analysis programs offered through the lube manufacturer.
Out of the twelve reports, there are three that I believe have significant value when it comes to information lube marketers are looking for: Program Condition, Turnaround Time and Severity Summary. A lubricant marketer can use the information provided in these reports as a touchpoint by sharing a snapshot of the overall program. This ensures the loyalty and pride in their product and the information provided will show that their distributors and end users are successfully monitoring the condition of their equipment.
Program Condition Report
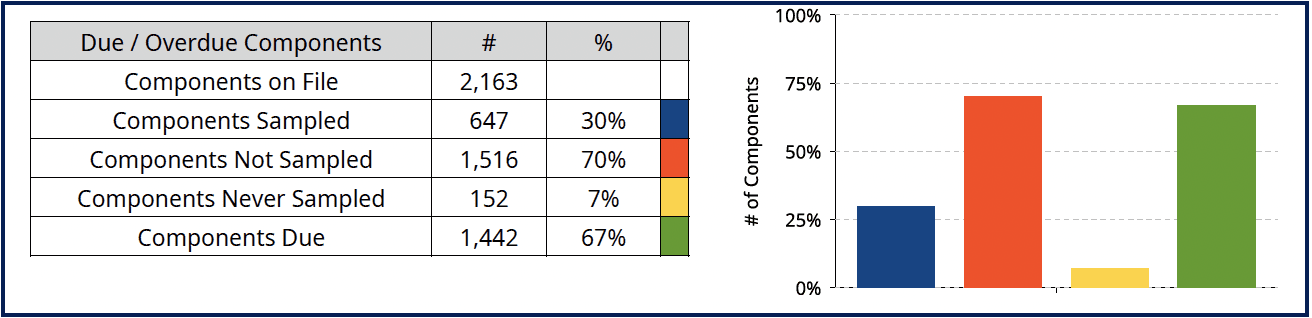
When reviewing the first section of the Program Condition Report, components due/overdue, you can see if the equipment is being tested and if the integrity of equipment is still in tack. The program condition data tells you if the team is being compliant and testing regularly – and it can be the starting point to set a trackable goal.
Turnaround Time Report
The Turnaround Time Report is crucial to program success, too. The information provided in this report reassures the laboratory is meeting their goal and the samples are getting to the laboratory within five days of sample being collected.
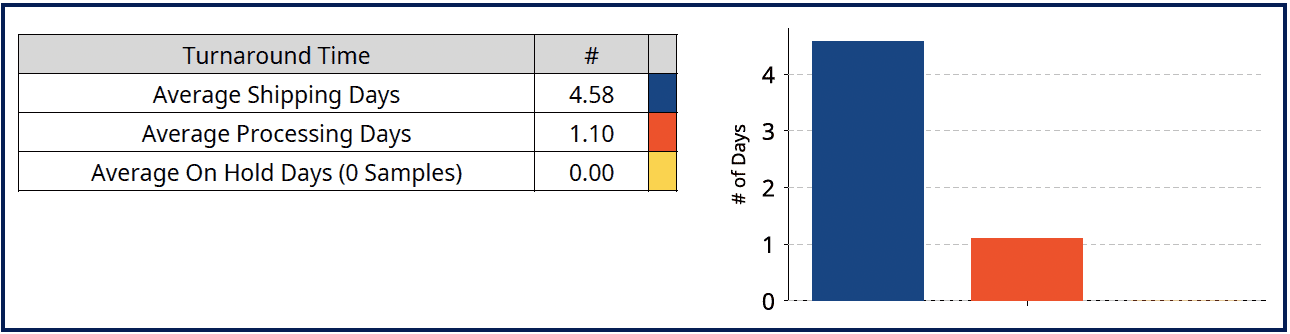
The report helps identify areas of improvement, for example, shipping challenges. The graph provides a topic of conversation that some folks may not think about: the importance of getting samples to the laboratory as soon as possible to get results fast and avoid any potential downtime.
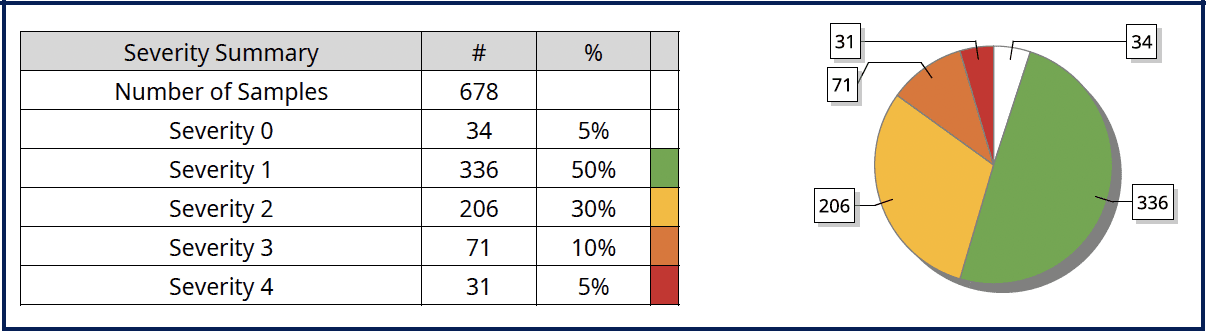
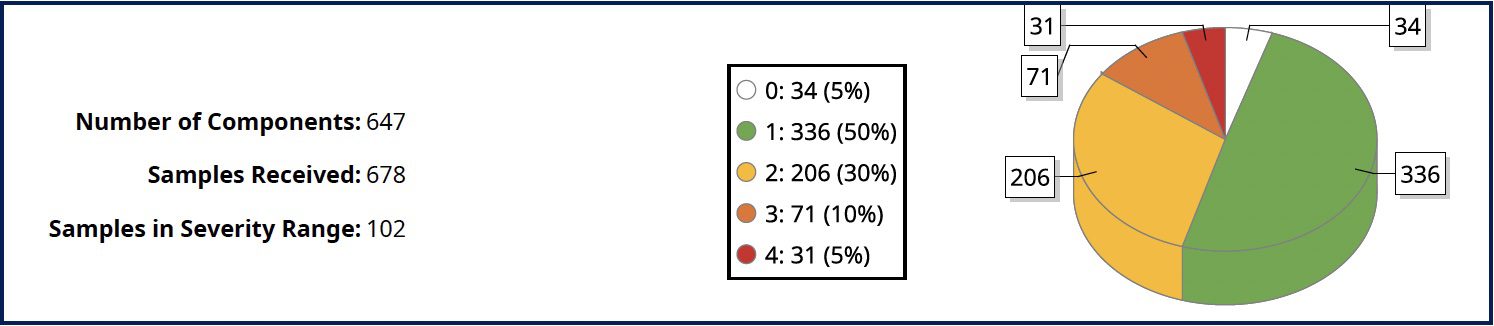
Severity Summary Report
The Severity Summary Report will help identify trending of the results, either up or down. This allows the users get in front of a potential problem and help identify some actions that needs to be taken. This opens up a discussion of the lubricants and where some improvements can be made.
If you are a lubricant marketer, I encourage you take a look at the management reports HORIZON offers. These reports make it easy to get a high-level overview of your customers, distributors and end users’ use of their fluid analysis program. If you need assistance, reach out to your account manager!
Proven Impact. Proven Uptime. Proven Savings.
Let us prove it to you.


 Oil Analysis: The First Question