
Where can you find education and training designed to give you the tools you need to see success along your reliability journey?
The answer: at the 2023 Reliability Summit | INTEGRATE.
We’ve revolutionized our annual maintenance training conference to provide all-encompassing training on every aspect of your fluid analysis program. From expanding your use of the HORIZON® platform, to understanding how to grow your program, learning how sampling can be made easier, to increasing understanding of result interpretation, to eliminating silos by integrating fluid analysis data into your maintenance management system, INTEGRATE is the one place you need to be.
View this year’s line up of speakers and learning sessions
In one trip to Indianapolis in October, you and your maintenance teams can gain new ideas, insights and knowledge to kick your maintenance into high gear and see your reliability program reap the benefits of effective, impactful fluid analysis.
Not only will you gain education, but you’ll also gain new perspectives. During this 2-day exclusive event, hosted by POLARIS Laboratories® at The Alexander in Indianapolis, you’ll have the chance to:
When you attend INTEGRATE, you get more than education through learning sessions, you get a first-hand look at not one, but two facilities through exclusive tours – and a chance to see inside POLARIS Laboratories’ headquarters laboratory in Indianapolis.
Cummins Augmented & Virtual Environmental Lab
![]()
Experience a tour of Cummins technical center and environmental lab and see what Cummins engineers and scientists are creating, testing and evaluating to prepare for the future of manufacturing. See processes and devices, including 3D printers, tomography x-ray systems and Cummins’ use of virtual reality.
U.S. Aggregates Facility & Mine Tour
![]()
Get a glimpse of U.S Aggregates’ 460-acre facility and see a glimpse into their mining operations. See how U.S. Aggregates mines and processes limestone, while getting a first-hand look and feel of a raw material reduction with the use of explosives.
POLARIS Laboratories®
![]()
This tour gives you a first-hand look inside our state-of-the art laboratory and headquarters facility in Indianapolis. From the time your sample hits the facility doors, to laboratory testing, to data analysis and customer support, and everything in between, this tour gives you an exclusive look into our laboratory daily operations.
These tours have limited spots, first come first served – register early if you want a seat on the tour. See the available tours and information here.
Our annual training conference would not be possible without our event sponsors. We’ve teamed up with several industry solutions providers (lube manufacturers, filter solutions, sampling supplies, data integration) to give you tools to advance your programs and expand your maintenance practices. Each sponsor will have an exhibitor booth at the conference as well. Please feel free to stop by their booths to see what they have to offer your program!
I’ll leave you with this question, where else can you find lube manufacturers, OEMs, testing experts, reliability professionals, integration solution providers and everyone in between? At INTEGRATE October 2-4 in Indianapolis.


EPA Regulations and The Clean Air Act
Since the 1990s, diesel fuel quality has been an essential topic of discussion due to the increased regulations that the U.S. EPA has implemented over the years as a result of the Clean Air Act (CAA). One of the main goals of this Act was to set and achieve National Ambient Air Quality Standards (NAAQS) in every state. The 1990 CAA amendments were later revised to include the issuance of technology-based standards that require the maximum degree of reduction of emissions of hazardous air pollutants. New regulations meant engine manufacturers and diesel fuel producers would have to work together to determine how to meet the new standards best.
Effects of Emission Regulations on Diesel Fuel
The most easily attainable and regulated fuel property that the EPA regulated in the 90’s was sulfur content. Historically, ASTM standards have limited sulfur content to .5% (wt.). A few years later, in October 1993, a limit for Low Sulfur diesel fuel was introduced as 500 ppm = 0.05% (wt.) to facilitate the particulate sulfate reductions to meet the emissions standards.
Fast forward to June 2006, the maximum sulfur level in the U.S. was reduced to 15 ppm (Ultra Low Sulfur Diesel) for on road (highway) diesel engines and fuel supplies and was subsequently adopted by all nonroad, locomotive and marine (NRLM) diesel fuel and equipment in 2014. In addition, the regulations prompted engine manufacturers to deploy catalyst-based emission control devices, such as NOx absorbers and Diesel Particulate Filters (DPF), to meet new diesel emission tier standards.
Sulfur emission reduction has also been an important subject for the maritime industry. In 2010, marine standards that were previously exempt were further reduced from previous levels to 1,000 ppm within the Sulfur Emissions Control Areas (SECAs) for North America and the U.S. Caribbean Sea. In January 2020, new international rules put forth under the International Maritime Organization also reduced the global sulfur limit (outside SECAs) in marine fuels to 0.5% or 5000 ppm (down from 3.5%), and the change is expected to have a ripple effect throughout the fuel industry.
The U.S. Energy Information Administration (EIA) has noted that the change in sulfur limits has wide-ranging repercussions for the global refining and shipping industries, as well as petroleum supply, demand, trade flows and prices. From market disruptions from the COVID pandemic and today’s economic pressures on buying and selling bulk diesel fuel to meet demands, monitoring the sulfur content of your diesel fuel is still important decades after emission standards were implemented.
Reducing sulfur content in diesel fuel has placed a new demand on diesel engines and emission control systems in operation today. Factoring in the aging and foreign fuel supplies in circulation and storage, along with the ever-changing regulations means ensuring that equipment fuel supplies meet the required specifications is now necessary.
Check out our recommended testing for diesel fuels here.

Proven Impact. Proven Uptime. Proven Savings.
Let us prove it to you.
Published February 3, 2023


With the increase of greener energy production, wind turbines are playing an increasingly important role. It is vital that these energy producing turbines operate at optimum capacity for extended periods of time. To do this, a high level of equipment reliability is critical and, due to remote locations or access difficulties, all maintenance needs to be planned at optimum intervals to ensure maximum uptime and reductions in total cost of ownership (TCO).
The operating fluids inside a turbine, including lubricating oil in gearboxes and hydraulic systems, fluids used in cooling systems and greases all play a significant role in optimizing operation of the wind turbine. All of these operating fluids should be monitored closely to determine the condition of the fluid, identify contamination and measure the levels of wear metals generated within each system.
Monitoring conditions through routine fluid analysis allows you to avoid unplanned downtime and perform necessary maintenance based what is actually happening within the unit rather than on the hours in operation or calendar days. Planned, predictive maintenance will get you to optimum energy production.
See the recommended testing for power generation equipment here.

Proven Impact. Proven Uptime. Proven Savings.
Let us prove it to you.
Published January 5, 2023

The HORIZON data management system is robust in all that it can provide to a fluid analysis program. Team training is conducted on features like the Dashboard, Reading a Sample Report, Equipment List Management, Mobile App and Sample Submission – which are all important for program success. But, one feature of HORIZON that is often underutilized or undertrained is Management Reports. These reports provide lube marketers and program champions an overview of their fluid analysis program and provides specific areas for improvement.
There are twelve management report options in HORIZON. This means you can view twelve different sets of data in different areas of your program. For lubricant marketers specifically, the information provided in these reports can provide a look at how distributors and end users are utilizing their fluid analysis programs offered through the lube manufacturer.
Out of the twelve reports, there are three that I believe have significant value when it comes to information lube marketers are looking for: Program Condition, Turnaround Time and Severity Summary. A lubricant marketer can use the information provided in these reports as a touchpoint by sharing a snapshot of the overall program. This ensures the loyalty and pride in their product and the information provided will show that their distributors and end users are successfully monitoring the condition of their equipment.
Program Condition Report
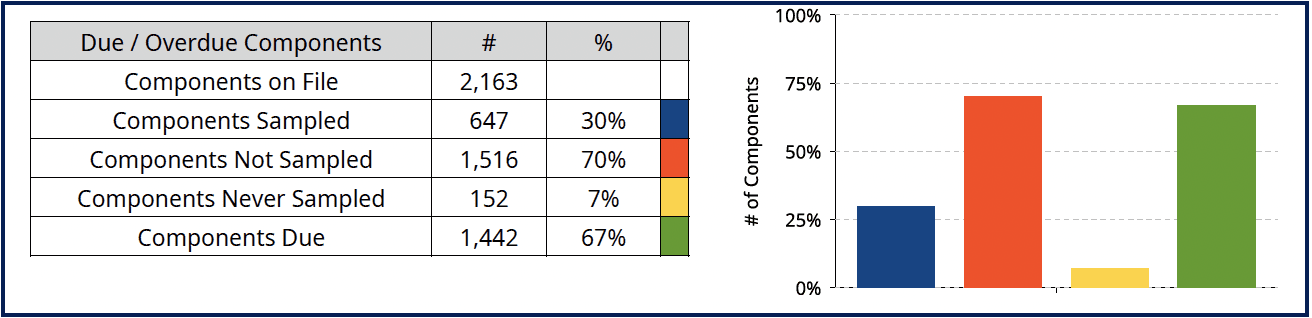
When reviewing the first section of the Program Condition Report, components due/overdue, you can see if the equipment is being tested and if the integrity of equipment is still in tack. The program condition data tells you if the team is being compliant and testing regularly – and it can be the starting point to set a trackable goal.
Turnaround Time Report
The Turnaround Time Report is crucial to program success, too. The information provided in this report reassures the laboratory is meeting their goal and the samples are getting to the laboratory within five days of sample being collected.
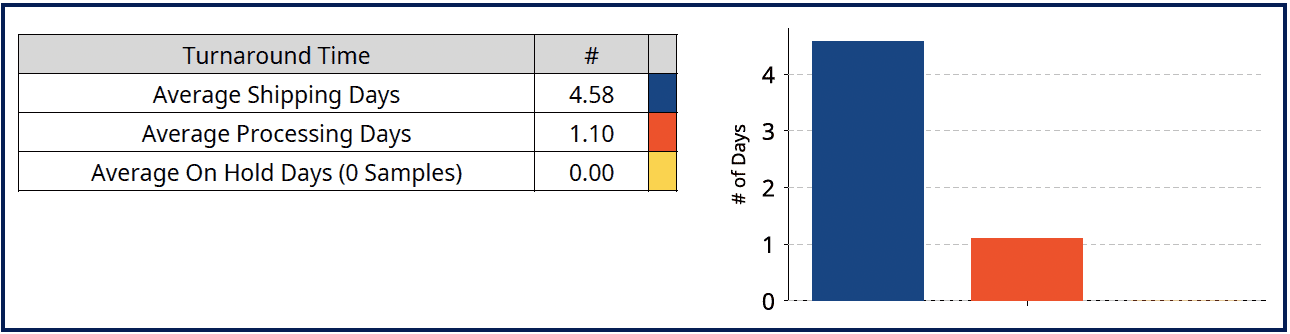
The report helps identify areas of improvement, for example, shipping challenges. The graph provides a topic of conversation that some folks may not think about: the importance of getting samples to the laboratory as soon as possible to get results fast and avoid any potential downtime.
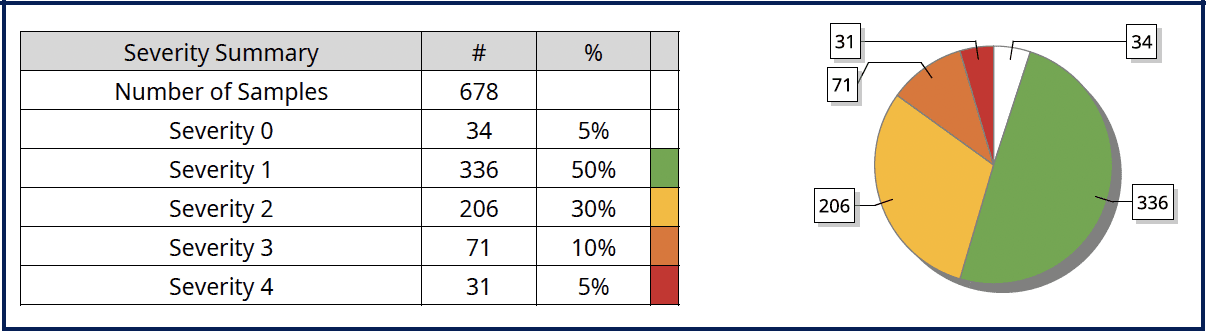
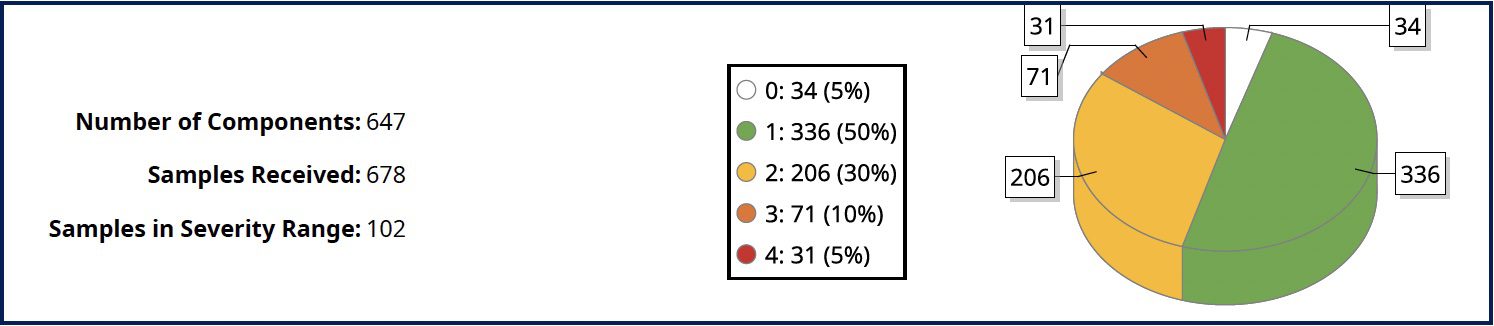
Severity Summary Report
The Severity Summary Report will help identify trending of the results, either up or down. This allows the users get in front of a potential problem and help identify some actions that needs to be taken. This opens up a discussion of the lubricants and where some improvements can be made.
If you are a lubricant marketer, I encourage you take a look at the management reports HORIZON offers. These reports make it easy to get a high-level overview of your customers, distributors and end users’ use of their fluid analysis program. If you need assistance, reach out to your account manager!
Proven Impact. Proven Uptime. Proven Savings.
Let us prove it to you.


The maintenance and reliability world is rapidly progressing with technology advancements and new digital solutions to integrate programs and data. We’re committed to help you, our customer, leverage these new advancements and innovations and achieve optimal equipment reliability.
Mission: Reliability, the 7th-annual Customer Summit, will focus on providing you the tools, resources and education so you can bring your program full circle.
Experience a Summit Like No Other
![]()
Mission: Reliability, taking place in Indianapolis October 3-5, will be unlike any Customer Summit to date or maintenance conference in the industry. Attendees will gain a full circle experience and see all aspects of maintenance and equipment management; from the lubricant manufacture, to the original equipment manufacturer, to the oil analysis provider, to seamless integration solutions.
In addition to keynote speakers, general and breakout sessions, workshops and networking, POLARIS Laboratories® has partnered with Allison Transmission and Cummins, to provide additional education and tour opportunities for Summit attendees. These exclusive OEM tours include:
During these tours, Mission: Reliability attendees will get a first-hand look at manufacturing and technology innovations these OEMs are putting in place to prepare for the future of equipment reliability.
We’re excited to bring these additional learning experiences to this year’s attendees and hope you will join us for Mission: Reliability in October. Will you accept your mission?
![]()

Proven Impact. Proven Uptime. Proven Savings.
Let us prove it to you.


Regularly sampling the oil, coolant and diesel fuel circulating within your systems used for power generation is vital to ensure the smooth and efficient operation of these systems when they are required to be used, either for back-up or permanent power.
It’s All in the Sample
Taking regular, representative samples is critical to guaranteeing accurate, actionable fluid analysis test results are determined. This helps assess the condition of your fluids and if any maintenance is required to ensure uptime of the equipment when needed.
Want to Get an Accurate Sample Every Single Time AND Save 5 Minutes Per Sample?
Of course you do! Using sample ports and valves ensures that representative samples are taken from all systems, each and every time by confirming that the fluid extracted is representative of the bulk fluid circulating within the unit. As well as providing the ‘best sample possible’, using sample valves also significantly reduces the time and labour required when taking samples. Studies show that using sample valves instead of traditional vacuum pump and tubing method reduces the sample collection process by up to 5 minutes per system. Samples can also be taken safely whilst the equipment is running which further enhances the quality of the sample.
There’s a Valve for You
Valves can be retro-fitted to fit any system and we’re here to provide guidance on the optimum valve required for the component. In addition, we help determine the valve location for any system to ensure the best possible sample can be taken. POLARIS Laboratories® can also provide you with a valve ROI calculator to demonstrate the potential cost savings of installing and using valves for your fluid analysis program.
Make the switch today and benefit from opening the valve on labour cost savings and increases in data-rich samples.
Contact us to start installing sample valves on your equipment.

Proven Impact. Proven Uptime. Proven Savings.
Let us prove it to you.

The most common cause of equipment failure is particle contamination. This includes external contaminants, such as dirt or sand, as well as the microscopic pieces of metal generated during equipment operation.
The following tests can further investigate the size and shape of the particles to help your team discover the source of the contamination and assess the damage to the component:
Each test takes a slightly different approach to this task, and each have their own limitations.
Thankfully, not every method should be included in every circumstance. Recommended tests vary based on type of equipment, equipment criticality, and operating cycles. POLARIS Laboratories® is here to help you choose the best, most cost effective testing for your application. Reach out today for assistance on selecting to correct method for each of your equipment to provide the best information to catch concerns early overall increasing your ROI.

Proven Impact. Proven Uptime. Proven Savings.
Let us prove it to you.

With the recent demand and reliance on back-up power generators as a result of 1) the global pandemic and 2) inclement weather forcing us to work from home more, this puts stress on the power grid as well as the internet connectivity now more than ever. Ensuring your back-up power generators are reliable and up and available when you need them is crucial during these times.
Here are some key points to help provide you with guidance on what to look for in our power generation systems, not limited to just engines, but the whole system. Monitoring radiator and coolant performance and fuel quality are keys to ensuring continuous uptime without any unexpected failures or run time issues.
All three fluid types (oil, coolant and diesel fuel) run within your system in sync. If any one component type isn’t running up-to-par, it will put stress on the other components leading to a snowball effect of failures. These can easily be prevented by putting in place preventive measures to minimize failures, incur maintenance/part costs and down time. Here’s why:
Oil | Checking your engine oil will ensure the engine is not experiencing any type of abnormal wear, contamination or oil degradation. This keeps the engine running longer and prevents overheating – resulting in a longer engine life cycle.
Coolant | Ensuring that you are using the right OEM-specified coolant is the first step. Make sure to test the coolant properties yearly for signs of degradation, checking that the coolant properties are still within range and what corrections/adjustments need to be made to the formulations.
Diesel Fuel | Making sure diesel fuel properties meet ASTM D975 requirements (learn more about ASTM D975 here), during the summer and winter months is key. The fuel needs meet the quality specifications will save you on any engine related issues.
Proven Impact. Proven Uptime. Proven Savings.
Let us prove it to you.
![]()
![]()
Corporate Headquarters
7451 Winton Drive
Indianapolis, IN 46268
+1.317.808.3750
Mon 7:30am thru Fri 7pm. ET
![]()
![]()
![]()