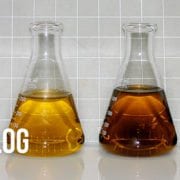
Dangers of ASTM D2896 Base Number Testing


ASTM D2896 Base Number

The first concern I have with ASTM D 2896 is a concern of laboratory safety, which I am quite concerned with and most customers are unaware of. Simply put, the safety concerns of ASTM D2896 are considerable. The reagents used for this test are basically some of the most hazardous I have ever encountered in my professional career.

Hazardous Chemicals

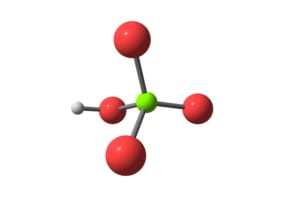
The titrant used in ASTM D2896 is Perchloric Acid. This is a very strong acid that is corrosive, an oxidizer and may cause organ damage over prolonged periods of exposure. As an oxidizer, it has been known to cause explosions. One of the solvents used in this test is Chlorobenzene, a chlorinated solvent that is extremely harmful to the environment. In fact, it is so harmful that it is banned in many countries around the world. Suffice it to say, the chemicals used in this test are dangerous to those who perform the test.

Perchloric Acid

On February 20, 1947, a violent explosion rocked the city of Los Angeles, California resulting in the deaths of 17 people and the wrecking of 116 buildings including the complete demolition of the O’Connor Electro-Plating Works, source of the blast. From the mass of information and misinformation, which varied from the early rumors of a powerful new army explosive, prematurely set off, to the decision, almost three weeks later, of the coroner’s jury that the explosion may have resulted from the contamination of a solution of perchloric acid and acetic anhydride with “easily oxidizable materials,” perchloric acid emerged as the nation-wide object of underwriters’ investigations.


Right Tests, Right Fluids, Right Equipment, Right Environment

My other concerns are with providing fluid analysis results that use the right tests on the right fluids for the right equipment in the right environment. Tests and test methods could change based on all of those factors, and too many customers request ASTM D2896 to measure an oil’s base number for good, yet misguided, reasons.

Background on Base Number Testing

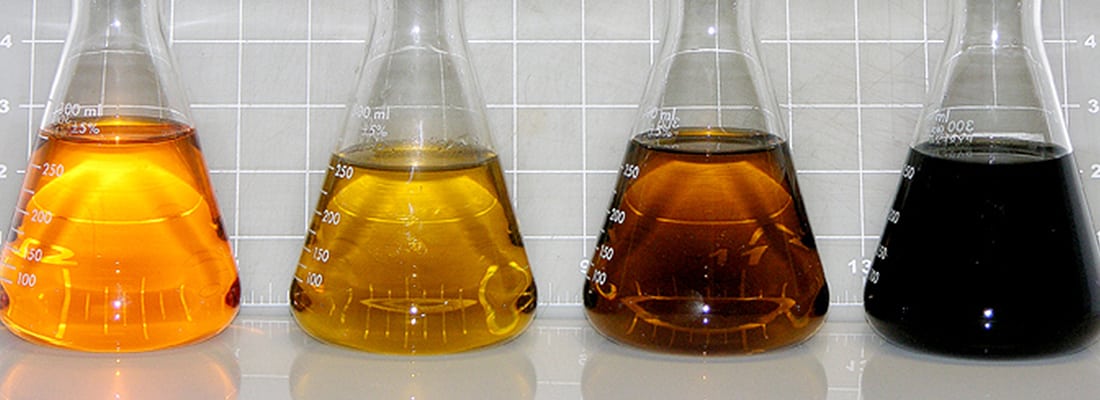
First, a little bit about base number and how it is measured. The results from a base number test is vitally important to you from a maintenance and reliability aspect. Alkaline elements are added to base oils to react with the weak acids formed during diesel fuel combustion. The alkaline reserve neutralizes the acids and form slightly basic degradation products that are no longer capable of reacting to the weak acids. Eventually the alkaline reserve in the lubricant is depleted to the point where the oil can no longer protect equipment from acid corrosion.

Brief History of ASTM D2896

ASTM D2896 was designed purely to determine alkalinity reserve in new lubricants. I’ll repeat that last bit, as it is the crux of the issue; new lubricants. The test uses Perchloric Acid as a titrant because it reacts quickly and reliably with the large alkalinity reserve in new lubricants. ASTM D2896 then measures the titration product to determine the strength of the alkaline reserve. This method is reliable, which is why it is still used by oil manufacturers and listed on oil spec sheet.

However, perchloric acid is too strong to use when weakly-basic degradation products are present, especially oils used in internal combustion engines. When ASTM D2896 is applied to in-service fluids, the perchloric acid reacts to every basic element available. Instead of measuring the alkaline reserve like we want, it also titrates with the degradation products. This can result in what ASTM refers to as a “falsely exaggerated” or sometimes even “falsely understated”. For these reasons, ASTM says:

“When the base number of the new oil is required as an expression of its manufactured quality, Test Method D2896 is preferred, since it is known to titrate weak bases that this test method (ASTM D4739) may or may not titrate reliably.”


ASTM D4739 – A New Method?

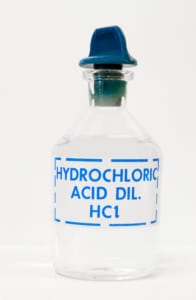
The solution required a new method for base number testing in in-service fluids. ASTM D4739 substitutes Hydrochloric Acid as the titrant rather than perchloric acid. Because hydrochloric acid is weaker than perchloric acid, it only reacts to the alkaline reserves and not the slightly-basic degradation products.


Further, ASTM D2896 can give very poor inflection points or even multiple poor inflection points on in-service lubricants, especially if they are seriously degraded. This makes giving accurate and reliable results challenging at best, and flat out wrong, at worst. To make this scenario even worse, perchloric acid will react with wear metals in the in-service fluids. This will result in more titrant being consumed, giving a higher base number results. This can result in hiding a problem that could be resolved if you knew the real value.

The ASTM methods are pretty clear on this. ASTM D2896 should be used for new lubricants and ASTM D4739 should be used for in-service applications. However, many customers request ASTM D2896 on in-service lubricants. Why is that? I believe the main driver of this is the fresh lubricant specification or certificate of analysis lists ASTM D2896 as the method for base number testing.

ASTM D4739 / ASTM D2896 Scenario

An important part of the discussion is this essential fact- not all the tests performed on a lubricants certificate of analysis are pertinent for condition monitoring of in-service lubricants. Many tests performed on fresh lubricants are designed to prove that all additives have been added to the blend as a quality control test. As a result, if you only request testing based on your certificate of analysis from the manufacturer, you are not getting the right data to make an accurate and reliable maintenance recommendation. Best case scenario, you are paying for testing that gives you no or limited information on the maintenance and reliability of your equipment. Worst case scenario, you could be getting misleading results. This is particularly the case in the ASTM D4739 / ASTM D2896 scenario.

Change to ASTM D4739

As a result, ASTM D4739 is definitely the method of choice for in-service fluids. Do yourself a favor, make the change today and improve the quality of the information you can use to improve your reliability.

Proven Impact. Proven Uptime. Proven Savings.
Let us prove it to you.

Published July 7, 2020

The Importance of Submitting a Baseline Reference Sample

What is a Baseline Reference Sample?

A baseline reference sample is a sample of new or unused product submitted to the fluid analysis laboratory. Submitting a baseline sample allows you to gain an understanding of the starting values of the product in use. It is important that the baseline sample being submitted has not been introduced into a system as this can introduce variables such as commingling, contamination or degradation. Ideally the sample should be pulled from a verifiable source such as a bulk tank, tote, pail or bottle.

What are the benefits of submitting a Baseline Reference Sample? 

It is important to have an understanding of what the starting values are for your lubricant. Knowing where the base number (BN) and/or acid number (AN), oxidation and nitration values start will provide a more precise prediction of how the used oil sample should be flagged as the lubricant degrades. Likewise, if the additive levels are known then it is easier for the Data Analyst to determine if the lubricant was actually installed in the machine.

What does the laboratory do with my Baseline Reference Sample?

Baseline samples are account specific, meaning they will be used on the account for which they were submitted and appear on used oil sample reports using the same product. When submitting a baseline sample, it is important to correctly fill out the sample paperwork to indicate it is a baseline sample by checking the box labeled “baseline reference”.  Selecting this box will automatically enter baseline sample as the component type.

Being careful to provide the complete product information (manufacturer, product name and viscosity grade) and using a specimen from a known, verified source will ensure the information generated by the laboratory will be useful and reliable for comparison against future used or suspect samples. Once an account has an established baseline reference sample, it is important that used samples with the same product have the product information listed exactly the same as the baseline sample. This will ensure the baseline and the used samples are linked for comparison on your reports.

Proven Impact. Proven Uptime. Proven Savings.
Let us prove it to you.

Published June 9, 2020

Sink or Swim: Fluid Analysis + Marine

In today’s shipping environment, uptime, safety, equipment life extension and increasing oil drain intervals are, and should be, the focus of any fluids analysis program.

Realizing the most value from your programs, whether lubricants, coolants, fuels, grease or filter debris analysis can help avoid:

  • Unscheduled down time and unplanned maintenance and associated costs for repair
  • Urgent requirements for lubricant replenishment inventory on short notice or in remote areas
  • Extra lubricants expense incurred by changing the oil unnecessarily without the benefit of a historical analysis report
  • Undetected problems manifesting into eventual catastrophic equipment failure

Oil analysis has been around since the 1940’s but, has matured significantly since then. Equipment has also evolved as design or environmental pressures have placed requirements for some equipment to be lighter in weight, be more fuel efficient and be manufactured to higher tolerances with more exotic materials. The result often places more stress to the lubricant, often with a lower volumes of lubricant in circulation to save weight.

Standard Practices

Take for example, marine or power plant engines with anti-polishing rings in the cylinder liners. The use of anti-polishing rings result is lower oil consumption which is an advantage for the equipment owner, but already places higher duty on the lubricant due smaller oil sump volumes and less need for frequent oil top ups. Monitoring critical parameters such as base number with laboratory and onboard testing has worked well and is already proven to be an industry standard practice.

Seeing An ROI

The benefits of your fluids analysis program can very easily pay for itself by being able to more closely monitor equipment and fluid condition, help manage implementation of oil drain interval programs, and in all cases provides information on oil and machinery condition necessary to make informed decisions about operational reliability and future maintenance.

With management reporting tools, a fluids analysis program can bring all of this information onto one platform, making interrogation of key performance indicators across assets much easier to visualize. Used properly, outliers can be detected more quickly. Of course, oil analysis is only one part of a complete maintenance program and should be used in conjunction with vibration, acoustics and thermography where applicable.

Free webinar on Fluid Analysis in the Marine Industry

If you’re interested in learning about fluid analysis as it relates to the maritime industry, I encourage you to attend our upcoming webinar on June 16. There is no cost to join and open to everyone!

Sink or Swim: How Fluid Analysis Saves Marine Engines

June 16 at 11 a.m. ET

See what will be covered and register here.

To learn more about POLARIS Laboratories® please contact us. We will show you the POLARIS Laboratories® way of helping you build a custom fluids analysis program with all the benefits of linking to your CMMS program, providing you with actionable fluids analysis commentary, and an online reporting portal, all with the benefits of being an independent laboratory and helping you save money.


Proven Impact. Proven Uptime. Proven Savings.
Let us prove it to you.

Published March 25, 2020

How to Optimize Your Asset Health

The average asset manager runs an average of approximately 10,000 hours on the asset before it’s sold. So, you’ve had your asset for a while, but it has come time to sell it. Yet, you wonder how much life is left on that asset? If you keep it for another 10,000 hours, you can save a lot of money in replacement costs and maintenance. Your asset has run well, you know its maintenance history and you ask yourself do I really need to sell it?

Deciding whether to repair or sell

Many fleets run equipment to about 80 percent of their life expectancy then sell off. But, did you know you can incorporate filter debris analysis to determine equipment reliability at that 80 percent life expectancy? If an issue is found, you can proceed with a rebuild/repair or they can sell. Things to consider when making the decision to sell:

  • Did you buy your asset used?
  • How was your asset’s maintenance history prior to you buying it?
Utilizing filter debris analysis

You can utilize filter debris analysis (FDA) to determine how your asset is and how it’s holding up. Here are a couple of recommendations how to incorporate FDA into your program, depending on the estimated life expectancy:

0-20% You could characterize this as break in or, in the case of used equipment, the baseline of your equipment. What is the wear pattern in the first 20% of your usage of the asset? Submitting three filters with oil samples on regular intervals can give you a pattern.
20-80%  Recommended to test only when wear metal trends are increasing, or you see a significant jump in wear metals
80%>  This is what is referred to a senior asset. Submitting three filters with oil samples on regular intervals can give you a pattern. Then review to determine retesting interval based on results of the FDA results. You may find you need to sell your asset before significant maintenance will occur, or you may find your asset has plenty of life on it.
See what’s being caught in your filter

FDA is a great tool to add to your asset reliability toolbox. It compliments fluid analysis testing by seeing not just the data circulating in the oil, but what is being caught in the filter. This data is crucial to understanding the reliability of your equipment.

See how one company was able to to save more than $250,000 by performing the testing and avoiding gearbox replacements.

Is filter debris analysis something you want to start performing on your asset? Contact your account manager or custserv@eoilreports.com to add it to your program.

Proven Impact. Proven Uptime. Proven Savings.
Let us prove it to you.

Published March 18, 2020

Learn Why Reliability Matters

W Edwards Deming once said, “Learning is not compulsory; it’s voluntary. Improvement is not compulsory; it’s voluntary. But to survive, we must learn.”

And, POLARIS Laboratories® is ready to help you learn…about the future.

We partner with program champions from companies all around the globe and, together, we have helped them save more of their equipment. Yet, the world is advancing rapidly so we’re committed to helping our customers leverage new innovation, creativity and strategy to improve their programs. By embracing change through proven telematics and connectivity capabilities, maintenance professionals have embarked on a continuous journey to Unlock Reliability.

Now, just imagine how effective your fluid analysis program could be if you could successfully automate the information you receive and then transform those untapped recommendations into business intelligence. Come, let us show you. This will be on full display for three days at our fifth annual Customer Summit in Indianapolis from November 18-20, 2019.

Whether you’re looking to huddle with companies that have proven successes, dive deeper into your program’s performance or learn best practices to design a strategy that transforms information into intelligence, our fifth-annual Customer Summit will provide the keys you need to drive operational performance. With three days of reliability insights, 16 learning sessions, three training workshops, one free program review for current customers and countless hours of peer-to-peer networking, this program is designed not only for you … but a few of your colleagues, too.


Here are a few key day-by-day highlights from this year’s conference:

  • Day 1:
    • Exclusive behind-the-scenes laboratory tour at POLARIS Laboratories’ headquarters
    • Interactive networking reception to help you connect the importance of identifying a reliable root cause to common equipment failures
  • Day 2:
    • Compelling look into why the future is now when it comes to reliability
    • Recognition of our annual Program Champion Award finalists
    • Relaxing dinner and reception at an upscale, car storage facility where you can slide behind the wheel and marvel at the engines of these classic, exotic, luxury cars
  • Day 3:
    • Insights on how to turn early savings into lasting success as you expand your program to involve new locations and testing capabilities
    • POLARIS Laboratories’ commitment to the next generation of fluid analysis through connectivity

Join us and learn why reliability matters! The road to fluid analysis success starts right here at the 2019 Customer Summit!

Learn more about the robust agenda and topics, exclusive laboratory tour, hotel accommodations, fees and more. Seating is limited – and hotel rooms are equally limited – at The Alexander Hotel! Clear your calendar November 18-20 and join us in Indianapolis at the 2019 POLARIS Laboratories® Customer Summit, Unlock Reliability.


Proven Impact. Proven Uptime. Proven Savings.
Let us prove it to you. 

Published August 27, 2019

VIDEO: Adding Equipment in HORIZON®


Adding one or more components to your equipment list in HORIZON® is easy! Making sure your equipment list is up-to-date is essential for your program to be a success. Check out the our new video for step-by-step instructions on how to add and edit your equipment in HORIZON.

Click to watch

Proven Impact. Proven Uptime. Proven Savings.
Let us prove it to you. 

Published  June 24, 2019

The Key to Unlocking Reliability in Your Program

Everyday at POLARIS Laboratories®, we’re dedicated to helping our customers save more of their equipment. As the industry has advanced, POLARIS Laboratories® has kept up by unleashing the potential for maintenance programs everywhere. We’re achieving these results by empowering maintenance professionals, automating the information they receive and transforming untapped recommendations into business intelligence.

This Year’s Summit

We’re all on this journey together. And, we see this path leading us to greater emphasis on reliability. We know reliability is the key to solving maintenance challenges smarter and faster. That’s why this year’s Customer Summit theme is Unlock Reliability. This unique, peer-to-peer experience is designed to help your company capture and apply the elements of a successful oil analysis program, integrate data better and solve reliability challenges.

As part of the evolution of fluid analysis at our summits – Driving Action, Champion Impact, Connected Performance and Elevate – Unlock Reliability keeps our customers focused on how to turn data into information into intelligence. At the summit, more than 100 customers and partners will convene to learn how to bridge a traditional fluid analysis focus with a futuristic view of empowering the overall user experience and manage more effective maintenance programs.

Unlock Your Maintenance Potential

Whether you’re looking to huddle with companies that have proven successes, dive deeper into your program’s performance or learn best practices to design a strategy that transforms information into intelligence, our fifth-annual Customer Summit will provide the keys you need to maximize your oil analysis program and continue to drive operational performance.

We have coordinated every aspect of this event to best fit your team’s needs and ensure that you make the most out of your summit experience. Taking place in Indianapolis from November 18-20, this three-day, 19-session event offers a one-of-a-kind experience for you and your team.

Are you ready to take the next step to realizing reliability?

Check out our Customer Summit website to learn more about the robust agenda and topics, exclusive laboratory tour, hotel accommodations, fees and more. Be sure to take advantage of our early registration discounts.

Come learn why reliability matters! Clear your calendar in November and join us in Indianapolis at the 2019 POLARIS Laboratories® Customer Summit.

Proven Impact. Proven Uptime. Proven Savings.
Let us prove it to you. 

Published May 23, 2019

Celebrating 20 Years

As an innovative leader in asset management, reliability and fluid analysis, POLARIS Laboratories® celebrates two decades of accomplishments, successes and innovative solutions we’ve brought to our customers – all while continually saving their equipment.

The beginning

In 1999, we first opened our doors as an oil analysis laboratory, with a mission to provide excellence in oil testing, analysis, tribology expertise, data and recommendations. Our first laboratory was in Greenwood, Indiana and in 2002, we moved to the northwest Indianapolis area and have called that area our home since. In that time, we’ve grown from five to more than 200 employees (in seven global laboratory locations) – who strive every day to meet (and exceed) customer expectations.

20 Years in 5 Minutes

Watch the video to see highlights of our history, accomplishments and our plans for the future.

Our values

Our core values have remained the same throughout our 20 years, with an emphasis to convey to our customers that saving your equipment is more than just sending your sample into our laboratory and getting the results back. What continues to save equipment is customers using the recommendations we provide to take action, establish trend history and effectively manage their maintenance and reliability programs.

What it means

20 years of being the leading fluid analysis provider in the industry has amounted to 48,439 pieces of equipment and $253,575,289 saved for our customers. See below for a quick glance of a few POLARIS Laboratories® stats:

Looking forward

With our eyes on the future, we will continue to focus on providing our customers with the greatest quality of service, accurate and timely analysis results, specialty testing and innovative data integration solutions. We’re expanding our testing and analysis capabilities to include grease, we’re advancing our HORIZON® data management platform and we are increasing adoption of our game-changing solution for sample data automation and integration called DataConnect.

Cheers to 20 more!

View the full press release.

Proven Impact. Proven Uptime. Proven Savings.
Let us prove it to you. 

Published May 7, 2019

Expose What’s in Your Filters

Oil filters are designed to filter out potential contaminants, but the debris that is caught in the filter can help bridge the gap and tell you what’s really causing wear and tear in your system. Filter debris analysis (FDA) analyzes that debris. It helps identify harmful contaminants and wear-causing particles and mechanisms not detected by traditional oil analysis. FDA is preformed by the following laboratory tests:

  • Analytical Ferrography
  • Micropatch
  • Elemental Metals by ICP
  • Acid Digestion
  • Gravimetric Solids

Watch the video to see how we perform FDA at POLARIS Laboratories®.

1. Analytical Ferrography

  • Identifies particles by metallic or non-metallic and shape and color
  • Analyzes particles through a microscope to determine source of wear particles
  • Digital images of particles are included within the analysis report from the data analyst

2. Micropatch

  • Particles are identified and qualified as contaminates
  • Most particles detected by the micropatch test are too small to be detected through routine testing; therefore often times, micropatch testing is recommended after oil analysis is performed.

Analytical ferrography and micropatch tests are conducted underneath a powerful microscope and are often vital in determining wear particles and contaminates not seen by the human eye and not detected by field oil analysis.

3. Elemental Metals Analysis: Detects particles less than 8-10µ and reports data on 24 elemental metals.

4. Acid Digestion: Identifies large particles accumulated in the filter.

5. Gravimetric Solids: Determines total solids in filter based on mass.

The Next Level

Filter debris analysis takes elemental analysis to the next level to determine particle size and type of wear. FDA also allows you to perform root cause analysis of wear to detect early stages of component failures and in turn, helps extend the life of your components.

Discover more about Analytical Ferrography and Micropatch testing by reading this Technical Bulletin.

Proven Impact. Proven Uptime. Proven Savings.
Let us prove it to you. 

Published May 2, 2019

A Connected World: Fluid Analysis is No Exception

We live in a connected world. Our daily lives involve hundreds of interactions with data and technology so why should your fluid analysis program be any different? How you submit samples, receive results, manage test data and take action on maintenance recommendations will determine your program’s ROI. In turn, this affects the uptime and Total Cost of Ownership (TCO) of the equipment you operate.

We are all going through a technological revolution, so it is more important than ever to understand how our devices and The Industrial Internet of Things (IIoT) can be integral to your fluid analysis program.

One System: Smarter Actions

From a maintenance management perspective, viewing oil analysis results from an individual machine on the same screen as its vibration readings and data from sensors allows the engineer to react quicker to the recommendations, assess the bigger picture and understand that one set of results confirms another. This creates huge efficiencies and results in smarter, more accurate maintenance actions being performed. In turn, it leads to improved uptime, an increase in ROI returns and a reduction in the Total Cost of Ownership of the equipment being monitored.

A Solution

POLARIS Laboratories® has joined the technology revolution and is helping you get there, too. With our integration feature, DataConnect, internal data systems communicate and transfer your sample data and results back and forth on an hourly basis from HORIZON® so your own CMMS or SAP system is accurate, up-to-date and in the correct format at all times.

Part of a Routine

Most CMMS or maintenance management programs are utilized at point of application during daily plant walk-rounds, in sample taking or planned maintenance actions. This means there is a growing requirement to integrate the sample taking procedure into your internally-operated system to reduce the number of applications and processes used.

Your system working in conjunction with the laboratory’s system will enable you to use your own software to submit samples and ensure that the information is as accurate as possible (as with our mobile app) and performing all the duties in a ‘single screen’. Knowing when a sample should be taken and receiving the notification is vital for improving compliance and optimizing your fluid analysis program. In addition, having all of this information in a single program not only adds value to the program, but creates huge efficiencies in daily maintenance and reliability tasks.


Proven Impact. Proven Uptime. Proven Savings.
Let us prove it to you. 

Published April 29, 2019