VIDEO: How to Bridge the Gap with Filter Debris Analysis

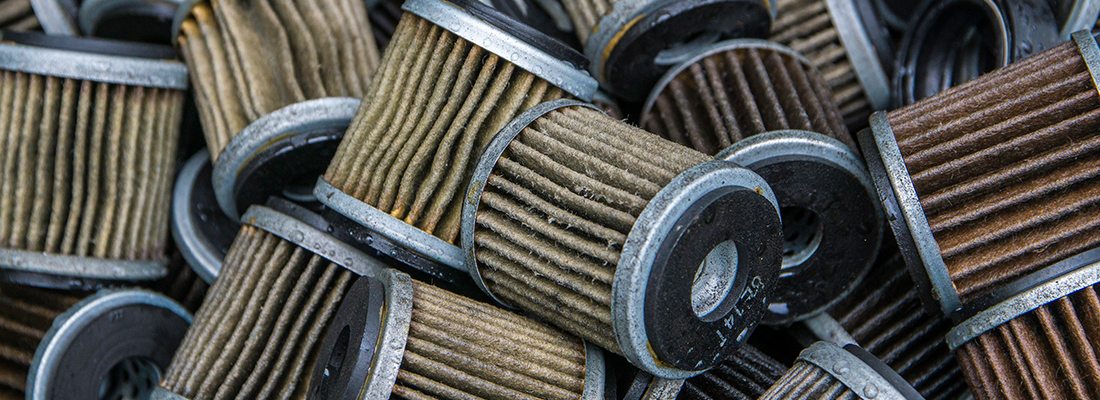
Oil filters are designed to remove contaminants and particles that would have otherwise damaged the system – but did you know this also removes the evidence that data analysts can use to provide in-depth maintenance recommendations? Dive deeper into the particles, contamination and evidence of wear that are caught in the oil filter by sending in your oil filter for Filter Debris Analysis.

FDA Dives Deeper Into Contamination Causes

Standard oil analysis (Elemental Analysis by ICP) can provide you with information on what’s going on in your equipment – but, there are limits to what ICP can detect. ICP can only detect fine particles of approximately 10 microns or smaller – leaving larger particles unidentified. Filter Debris Analysis helps identify larger wear particle debris as well as outside contamination. The wear morphology, metal type(s) and contamination types can be identified to help determine the possible source of the wear or contamination.

How is FDA Performed?

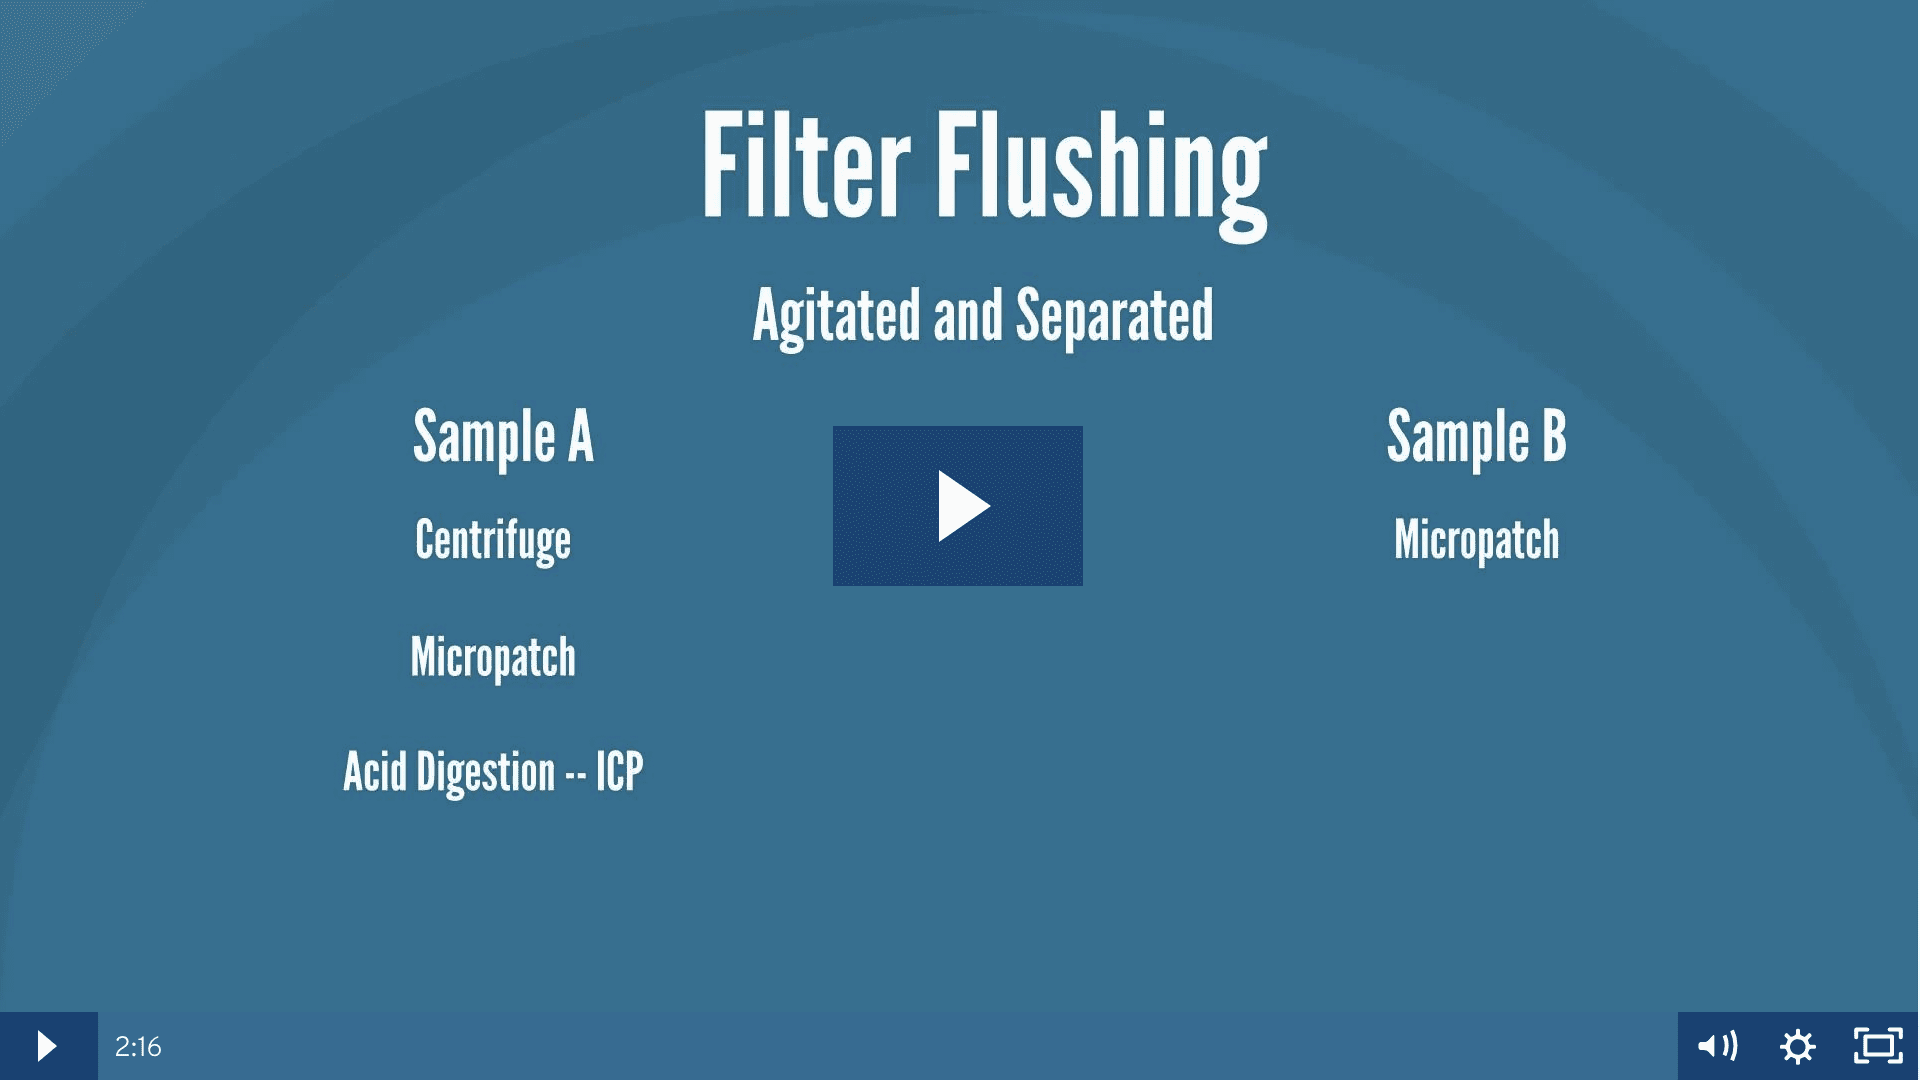
The FDA process involves flushing the filter, extracting the particles and performing several tests (including micropatch and analytical ferrography) to identify wear particles. Check out the video below to see how we perform Filter Debris Analysis at POLARIS Laboratories®:

Learn more about Filter Debris Analysis by reading our technical bulletin.

Interested in adding FDA to your current fluid analysis program? Contact customer service or your account manager.

Proven Impact. Proven Uptime. Proven Savings.
Let us prove it to you.

Published October 9, 2018

Take Action & See the Savings

Have You Taken Action?

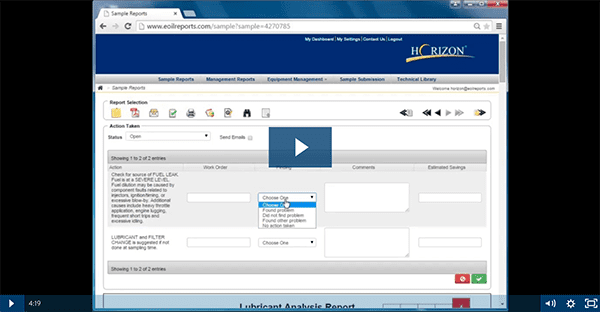
One of the most under-used and yet, most powerful tools that POLARIS Laboratories® data management system, HORIZON®, can provide our customers with the Action Taken function. Dive deeper into your sample data and recommendations and be able to:

  • Complete a work order from the recommended action item from the sample
  • Learn if you did or did not locate a problem in your equipment
  • Provide comments back to the laboratory based on your findings
  • Customize your results by narrowing down by date, severity or fluid type
  • Put in an estimated savings if you did find a problem

Run the Report an See Proven Savings

Want to see how much you’ve saved? Once you have completed action taken items you can run the Action Taken Summary Report out of HORIZON®. This report provides you with a summary of the actions that have been taken and allows you to spot trends and commonalities in issues you may be seeing, as well as provide you with total estimated savings that can prove the savings of your program. To learn more about how this report is run out of HORIZON, watch the how-to video below:

If you would like to see a demonstration of this tool, please reach out to your Account Manager.


Proven Impact. Proven Uptime. Proven Savings.
Let us prove it to you.

Published September 18, 2018

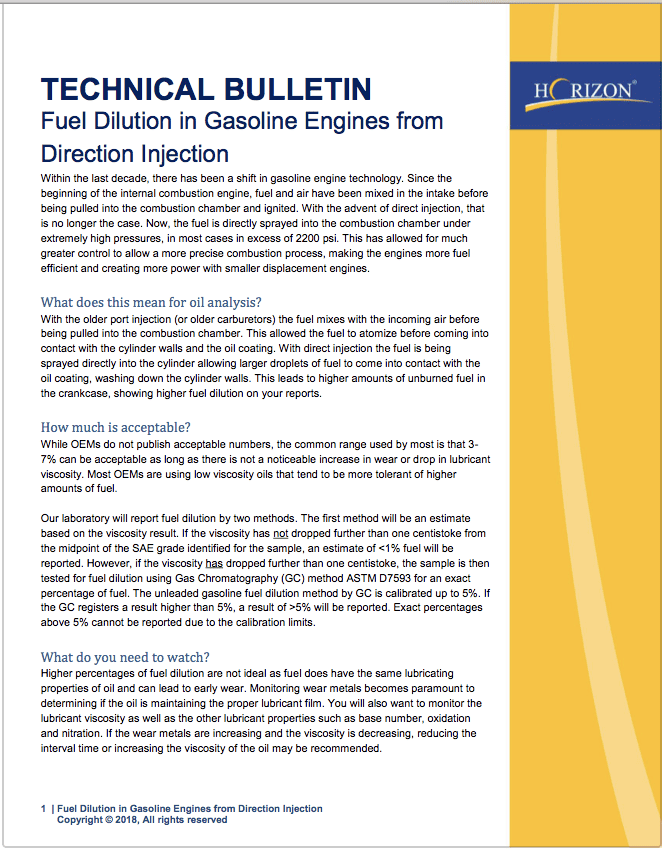
How Gasoline Engine Technology Affects Fuel Dilution

Do you have a newer vehicle? Are your reports showing high fuel dilution?

Changes in gasoline engine technology, along with direct injection, have affected the internal combustion process in a gasoline engine. But, what does this mean for oil analysis? We’ve received a large amount of inquiries and questions regarding this topic from our customers. Click below to download the newest Technical Bulletin to learn the differences in engine technology and how it can affect your fluid analysis results.

Proven Impact. Proven Uptime. Proven Savings.
Let us prove it to you.

Published September 4, 2018

How to Get Your Sample Results Faster

Are you wanting to receive your sample results and maintenance recommendations faster? There are many steps you can take to ensure you get your results in a timely manner – so you can quickly take action to save your equipment.

  1. Use HORIZON®
    • Register your equipment and components online or mobile app through our HORIZON data management system online or use the mobile app
    • Log your fluid sample (and barcode information) in HORIZON and submit it with the equipment information
    • Apply a barcode to your sample and send it in the mail to one of our laboratory locations
    • When we receive your sample in the mail, the barcode is scanned and automatically pulls up the sample and equipment information you submitted via HORIZON
    • Submitting your sample information online provides us with all the necessary information ahead of time – allowing us to send your results back to you faster
  2. Submit samples on the go
    • Using the convenient HORIZON mobile app for Android or Apple for mobile devices, you can submit samples right at your equipment, immediately after you take the sample
    • Submitting your sample information via the mobile app requires less fields of information
    • Read more about the benefits of online sample submission by reading Take Five and Submit Your Sample
  3. Eliminate errors if sending manually
    • If you choose not to register and submit your sample information via HORIZON, you will need to fill out the form by hand
      • It’s best to use an quick-dry ink pen to fill out the paperwork (make sure the writing is legible and the paperwork isn’t damaged from from oil spills). This will eliminate the need for sample processing to decipher handwriting or dirty paperwork – resulting in inputting incorrect information into our system.
    • Send in the sample information form with the sample to one of our laboratory locations
  4. Pull the best sample

In the maintenance field, timing is key – it can be the deciding factor whether your equipment breaks down and you have unexpected downtime. At POLARIS Laboratories®, we are continually making improvements so you can get your results back faster. After all, your equipments’ health and lifecycle depend on it.

If you have any questions about sending in your sample or need help setting up a HORIZON account, contact us at 317.808.3750 or email custserv@eoilreports.com.

4 Tips to Help You Become a Sampling Pro

Since we introduced our new 3 oz. sample jar that is better equipped for sampling, we’ve seen a drastic decrease in leaking, messy bottles arriving at our laboratory – meaning you get your results back faster.

There are many benefits to the, somewhat still new, 3 oz. sample jar we released to our customers in the beginning of 2017. These benefits include translucency, higher temperature threshold and cap-locking with a wedge seal feature to prevent leaks.

Below are some extra tips to make sure you’re properly using the bottle like a pro and sampling correctly, so you can get the most accurate and reliable test results.

  1. Pull samples utilizing safe sampling practices [see our blog Fluid Analysis 101: 5 Tips for Collecting the Best Sample] and proper protective equipment. While the 3 oz. sample jar is designed to withstand higher fluid temperatures, safety should always be top of mind.
  2. Once the fluid sample has been taken, inspect the jar for particles – now that you can see the fluid that was pulled out of your equipment (due to the translucency of the jar), be aware of what is floating inside so when your results come back, proper action can be taken.
  3. Fill the sample bottle only to the designated “Fill Line” – no higher.
    • If there is fluid in the neck of the bottle, air may not release causing the cap to not seal properly.
  4. Do not over tighten (torque) the sample cap. The cap’s unique locking feature helps to ensure that it doesn’t loosen when the sample jar cools and the wedge seal prevents leaking.

We hope these extra tips will come in handy when you’re taking your next sample. Here at POLARIS Laboratories®, we’re continuously making improvements and providing useful resources to help our customers maximize their fluid analysis program.

Proven Impact. Proven Uptime. Proven Savings.
Let us prove it to you.

Published August 6, 2018

Achieving Operational Efficiency Through Program Improvement

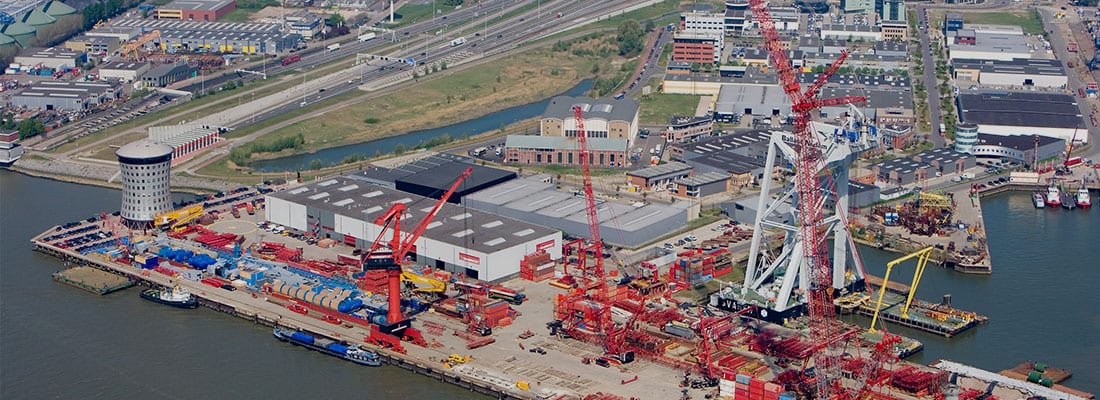
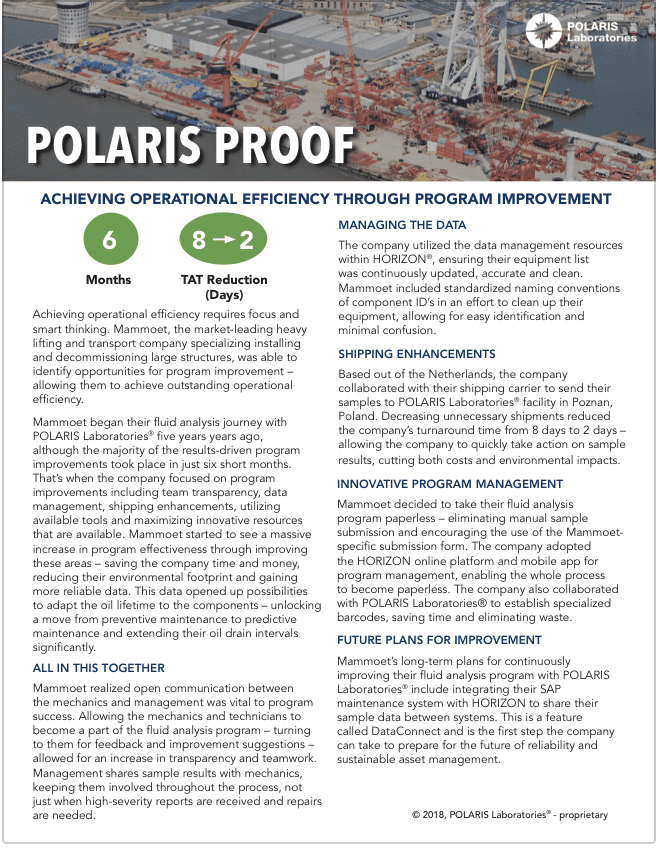
Achieving maintenance operational efficiency requires focus, smart thinking and innovation. Mammoet, a heavy-lifting and transport company, was able to identify areas and opportunities for program improvement – this included leveraging teamwork, maximizing data management, implementing shipping enhancements and taking advantage of program management solutions available.

The improvements Mammoet implemented in their program opened up the opportunity for the company to move from preventive maintenance to predictive maintenance and significantly extending their oil drain intervals. Learn more by reading the case study.

A Look Back: Oil Analysis Then and Now

As I look back, it is hard to believe I have now been involved in the oil analysis industry for more than 35 years. I was first introduced to this science in 1983, while in the military. I was assigned to my first permanent duty station as a track vehicle mechanic (MOS 63Y10). My motor officer was sold on the value that oil analysis offered and over time – I began to learn and believe in the value as well.

So what has changed over the years? First off, ‘oil analysis’ is now most commonly referred to as ‘fluid analysis’ as other fluids are commonly tested as part of customer programs – not just oil.

Then: Reactive

In the 80’s and 90’s, we used oil analysis to help prevent catastrophic failure from occurring. You might say a ‘just in time’ maintenance approach. If a high severity oil analysis report was received on a specific piece of equipment, the equipment associated with the high severity report would be moved up on the priority list for maintenance, more often than not a ‘reactive’ maintenance event.

Now: Predictive

Today, using not only oil analysis, but including fuel analysis and coolant analysis, to prevent catastrophic failures from occurring remains a primary goal. However, if you end your focus there you are missing out and not taking full advantage of what these services can offer your maintenance program today.

World-class maintenance organizations are now taking advantage of the full capabilities that an effective fluid analysis program offers. They are no longer just concentrating on preventing catastrophic failures, but also:

  • Monitoring oil condition: allowing the ability to optimize drain intervals.
  • Monitoring fluid cleanliness: taking action to filter and clean fluids and by doing so, greatly increasing component life hours.
  • Monitoring additives: allowing the ability to quickly detect when lubricant mixing or cross contamination has occurred
  • Moving from preventative maintenance to predictive maintenance: with fluid analysis, and additional non-invasive testing technologies, we can monitor the health of the components. Thus, allowing to move away from the old practices of replacing or rebuilding components on a prescribed interval and performing rebuild and replacements only when alerted to do so.
  • Coolant analysis: For liquid-cooled components, coolant analysis is essential. Did you know that more than 50 percent of all “preventable, premature” engine failures are related to cooling system issues?
  • Fuel analysis: For today’s diesel engines, tolerances are tighter than ever before. Issues with fuel results in fuel system wear, decreased performance and even failure.

It’s No Longer Reactive

There is much more that a quality fluid analysis program program offers. Since today’s fluid analysis capabilities alerts us to the very earliest stages of wear, we are able to plan and schedule maintenance activities and move away from reactive, unplanned events. By doing so, we find that equipment availability increases, completion rate of scheduled events improves, the safety risk associated with reactive maintenance is greatly diminished, equipment availability improves and maintenance cost are reduced.

Testing Procedures Have Changed, Too

What about the test procedures themselves, have they improved over the years? The answer is yes! When I first began my career, the standard test slate included monitoring 18 elements for routine testing. Today, POLARIS Laboratories® standard routine test slate includes 24 elements, allowing the monitoring of wear for the latest generation of your equipment. The improvements have not stopped there. Improvements in particle counting, fuel dilution, soot, water and even the reporting software have seen great improvements as well.

Innovative Report and Software Advancements

When it comes to the reporting software, we are no longer limited to reviewing just a single report but we can quickly identify common causes of high severity reports, amongst common component types and adjust our maintenance activities and strategies to overcome potential issues. Today’s testing can truly provide a significant return on investment and help keep your equipment running better than ever before.

In closing, I leave you this advice. Identify the goals of your fluid analysis program, then check your fluid analysis test package profile and ensure that the test that are being performed by your service provider includes the individual test to meet those goals. The times and the testing have changed and all test packages are not created equal. Goals and testing need to be aligned. If you have questions or would like to evaluate you current program I encourage you to contact your laboratory.
 

Proven Impact. Proven Uptime. Proven Savings.
Let us prove it to you.

Published July 24, 2018
Are You Using the Right Test Package?

POLARIS Laboratories® offers a wide range of fluid analysis test packages and choosing the right ones for your equipment can be difficult (especially if you’re new to fluid analysis). The most common mistake is believing basic testing is a good starting point for all programs. Basic tests for testing your oil, coolant and diesel fuel are clearly much better than changing oil at set intervals and then fixing problems after the equipment breaks down. However, it can only provide limited maintenance recommendations. So, how do you know what test packages are best for your program?
What are the Goals?

A good place to start is going back to the goals of your program that were established when you started your fluid analysis program. For example, if your goal is to optimize drain intervals of diesel engines, you need to monitor trends on when oil properties break down and can’t protect the equipment adequately. Basic testing doesn’t provide the necessary testing (oxidation/nitration and base number) to gather the data for you to make an informed decision based on the results of a basic test. It’s important to re-visit the goals of your fluid analysis program before you approach test package options and this will allow you to determine whether you need basic or advanced testing.

An Example: Karl Fisher vs. Crackle

Some test packages seem to cover the same areas, but the more expensive the test is, doesn’t necessarily mean it will provide better recommendations. For example, the Karl Fisher test runs at a higher price than the crackle method, both tests measure the water concentration, but your equipment, fluid type and how the equipment is being used affects what test should be performed.

Crackle is only an estimate of the water content while Karl Fisher will accurately measure the water content and report it in percent or parts per million. Engine oils are designed to hold a certain amount of water, so it takes a high concentration to affect the system. Crackle testing is adequate for this purpose, while Karl Fischer testing is a bit of an overkill.

On the other hand, the fluid in a hydraulic or turbine system isn’t designed to absorb nearly as much water as engine oil. In addition, the concentration where water begins to damage those systems is below the detection limit of a crackle test. In this case, Karl Fisher testing is necessary to identify when the equipment is at risk.

Choosing a Test Package

When choosing your fluid test package, keep the big picture in mind – the real savings come from preventing breakdowns, optimizing fluid drains and extending the useful life of equipment. As long as your testing provides data and recommendations that support those goals, you’re on the right track. Click here to download the complete testing list of tests provided by POLARIS Laboratories®.

If you want to discuss your current fluid analysis program or discuss the test packages options available, contact your account manager or email custserv@eoilreports.com.

Proven Impact. Proven Uptime. Proven Savings.
Let us prove it to you.

Published June 28, 2018

Summer Heat Got You Down?

Cooling systems are already burdened with high operating temperatures, and summertime heat can take its toll on your equipment. In order to continuously improve your system’s life and maintain effectiveness, proper cooling system maintenance is vital.
So, what can you do to monitor and identify overheating issues that can lead to catastrophic failure, loss of productivity and a decrease in ROI? Routinely test your coolant – especially during the hot summer months. Read more in our technical bulletin.

Proven Impact. Proven Uptime. Proven Savings.
Let us prove it to you.

Published June 12, 2018

Is Your Program Losing Momentum?

Maintaining a successful program comes with challenges

Maintenance teams jump over countless hurdles and experience numerous challenges while building an efficient predictive maintenance program. These hurdles and challenges can result in the maintenance program slowly losing it’s momentum. Below, I’ve outlined some common reasons we see that could explain why maintenance programs may not live up to their potential and be maximized fully:

  • Budget | maintenance program is the first budget to get reduced
  • Leadership Changes | executive management changes can result in new overall maintenance goals
  • Loss of Value| the company may no longer see value in their predictive maintenance program

At POLARIS Laboratories®, we strive to establish, achieve and maintain rapport with our customers and who we call Program Champions. These Program Champions are true believers in the benefits, cost savings and increasing equipment reliability resulting from an effective fluid analysis program. As an Account Manager, I see the above reasons and changes occur more frequently than you would expect. Often times, when maintenance programs lose their momentum and begin to dwindle, the entire process for establishing a Program Champion and a routine, effective fluid analysis program starts over. Although this provides a struggle for us as a partner you as a customer – we see this as an opportunity to educate the maintenance team and executive level leadership on the importance of a successful predictive maintenance program while incorporating fluid analysis.

What do you do if your predictive maintenance program loses its momentum?

There are companies that provide solutions and services – whether it be a consulting firm or equipment manufacturer – for improving maintenance programs but ultimately, the customer is responsible for implementing the solutions and maintaining them.

Below are some practical ways to keep your predictive maintenance program from losing momentum – by utilizing existing resources.

  1. Establish a Program Champion who sees the value in improving equipment reliability who can train the maintenance team to maximize and execute the program.
  2. Keep in constant communication with the fluid analysis and other service providers.
  3. Partner with a reliable, accredited fluid analysis laboratory who can help the end user monitor their equipment’s condition before it becomes critical.

Overall, it’s important to overcome these hurdles and maintain your maintenance program, it could save you both time and money in the end. And, let’s face it – can your equipment afford not to?

Proven Impact. Proven Uptime. Proven Savings.
Let us prove it to you.

Published May 8, 2018