 As I look back, it is hard to believe I have now been involved in the oil analysis industry for more than 35 years. I was first introduced to this science in 1983, while in the military. I was assigned to my first permanent duty station as a track vehicle mechanic (MOS 63Y10). My motor officer was sold on the value that oil analysis offered and over time – I began to learn and believe in the value as well.
So what has changed over the years? First off, ‘oil analysis’ is now most commonly referred to as ‘fluid analysis’ as other fluids are commonly tested as part of customer programs – not just oil.
Then: Reactive
In the 80’s and 90’s, we used oil analysis to help prevent catastrophic failure from occurring. You might say a ‘just in time’ maintenance approach. If a high severity oil analysis report was received on a specific piece of equipment, the equipment associated with the high severity report would be moved up on the priority list for maintenance, more often than not a ‘reactive’ maintenance event.
Now: Predictive
Today, using not only oil analysis, but including fuel analysis and coolant analysis, to prevent catastrophic failures from occurring remains a primary goal. However, if you end your focus there you are missing out and not taking full advantage of what these services can offer your maintenance program today.
World-class maintenance organizations are now taking advantage of the full capabilities that an effective fluid analysis program offers. They are no longer just concentrating on preventing catastrophic failures, but also:
- Monitoring oil condition: allowing the ability to optimize drain intervals.
- Monitoring fluid cleanliness: taking action to filter and clean fluids and by doing so, greatly increasing component life hours.
- Monitoring additives: allowing the ability to quickly detect when lubricant mixing or cross contamination has occurred
- Moving from preventative maintenance to predictive maintenance: with fluid analysis, and additional non-invasive testing technologies, we can monitor the health of the components. Thus, allowing to move away from the old practices of replacing or rebuilding components on a prescribed interval and performing rebuild and replacements only when alerted to do so.
- Coolant analysis: For liquid-cooled components, coolant analysis is essential. Did you know that more than 50 percent of all “preventable, premature” engine failures are related to cooling system issues?
- Fuel analysis: For today’s diesel engines, tolerances are tighter than ever before. Issues with fuel results in fuel system wear, decreased performance and even failure.
It’s No Longer Reactive
There is much more that a quality fluid analysis program program offers. Since today’s fluid analysis capabilities alerts us to the very earliest stages of wear, we are able to plan and schedule maintenance activities and move away from reactive, unplanned events. By doing so, we find that equipment availability increases, completion rate of scheduled events improves, the safety risk associated with reactive maintenance is greatly diminished, equipment availability improves and maintenance cost are reduced.
Testing Procedures Have Changed, Too
What about the test procedures themselves, have they improved over the years? The answer is yes! When I first began my career, the standard test slate included monitoring 18 elements for routine testing. Today, POLARIS Laboratories® standard routine test slate includes 24 elements, allowing the monitoring of wear for the latest generation of your equipment. The improvements have not stopped there. Improvements in particle counting, fuel dilution, soot, water and even the reporting software have seen great improvements as well.
Innovative Report and Software Advancements
When it comes to the reporting software, we are no longer limited to reviewing just a single report but we can quickly identify common causes of high severity reports, amongst common component types and adjust our maintenance activities and strategies to overcome potential issues. Today’s testing can truly provide a significant return on investment and help keep your equipment running better than ever before.
In closing, I leave you this advice. Identify the goals of your fluid analysis program, then check your fluid analysis test package profile and ensure that the test that are being performed by your service provider includes the individual test to meet those goals. The times and the testing have changed and all test packages are not created equal. Goals and testing need to be aligned. If you have questions or would like to evaluate you current program I encourage you to contact your laboratory.
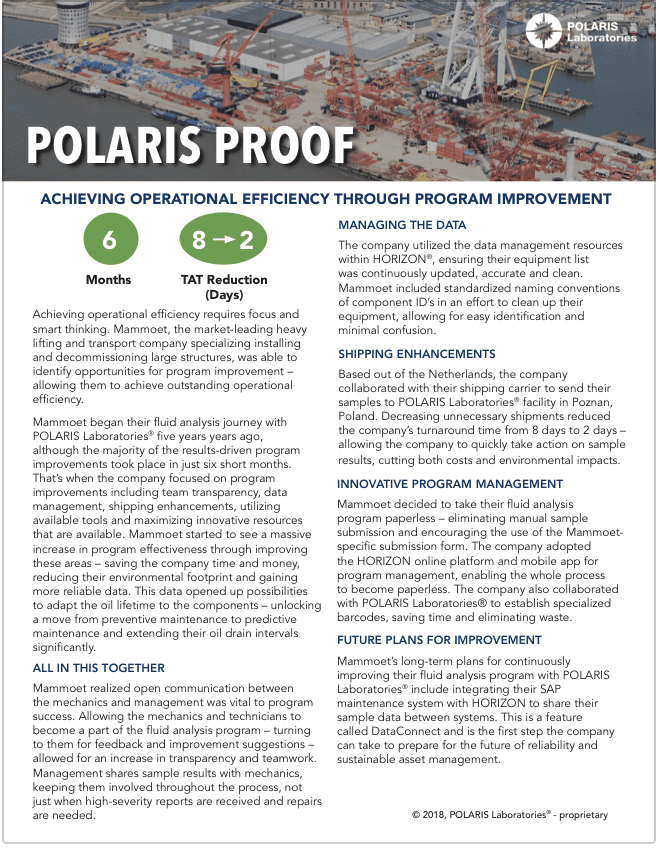
Proven Impact. Proven Uptime. Proven Savings.
Let us prove it to you.
Published July 24, 2018
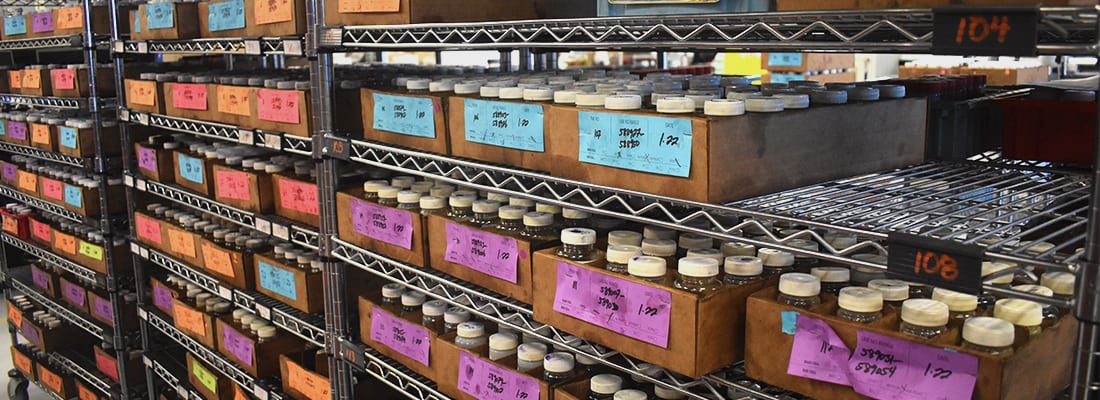
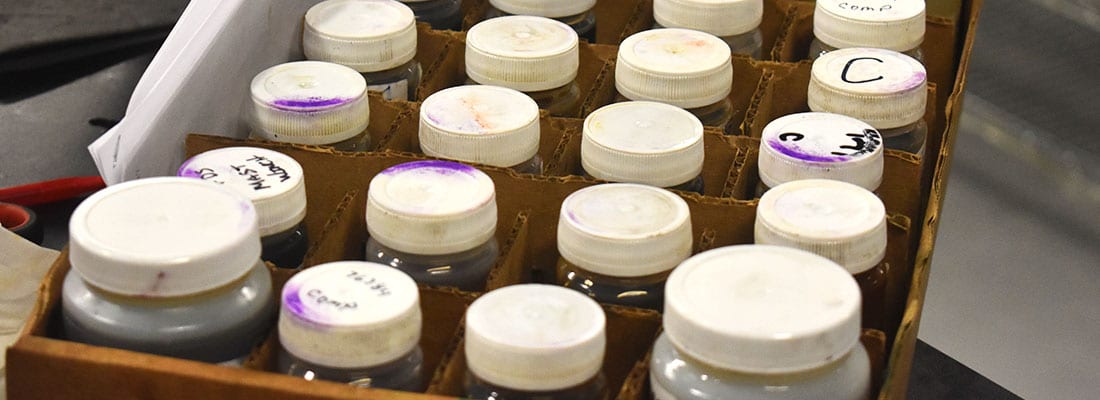 Since we introduced our new 3 oz. sample jar that is better equipped for sampling, we’ve seen a drastic decrease in leaking, messy bottles arriving at our laboratory – meaning you get your results back faster.
 POLARIS Laboratories® offers a wide range of fluid analysis test packages and choosing the right ones for your equipment can be difficult (especially if you’re new to fluid analysis). The most common mistake is believing basic testing is a good starting point for all programs. Basic tests for testing your oil, coolant and diesel fuel are clearly much better than changing oil at set intervals and then fixing problems after the equipment breaks down. However, it can only provide limited maintenance recommendations. So, how do you know what test packages are best for your program?
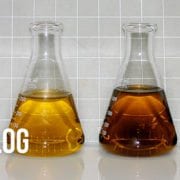
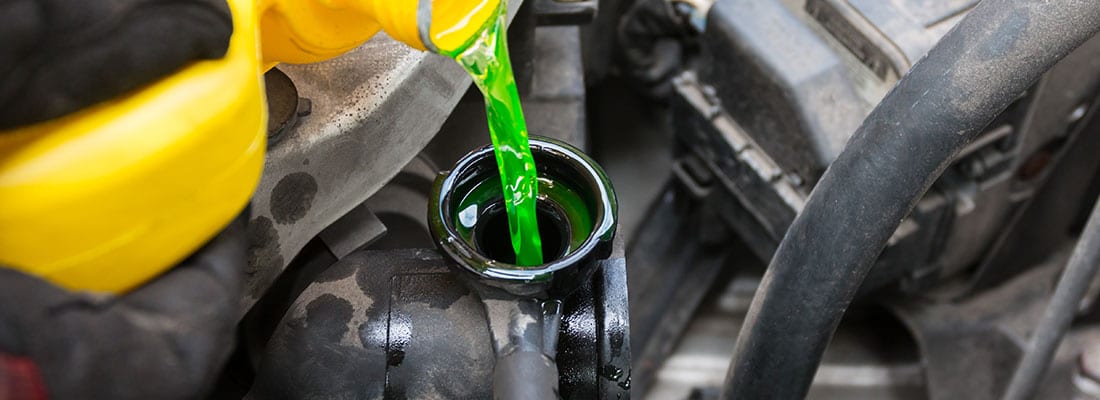 Cooling systems are already burdened with high operating temperatures, and summertime heat can take its toll on your equipment. In order to continuously improve your system’s life and maintain effectiveness, proper cooling system maintenance is vital.

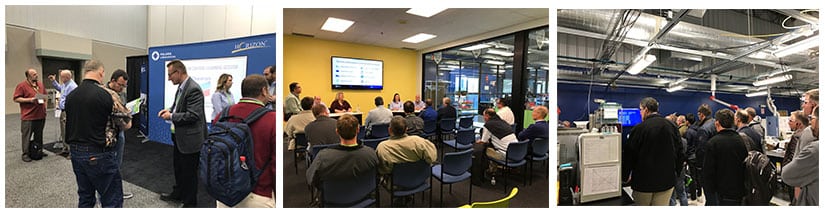
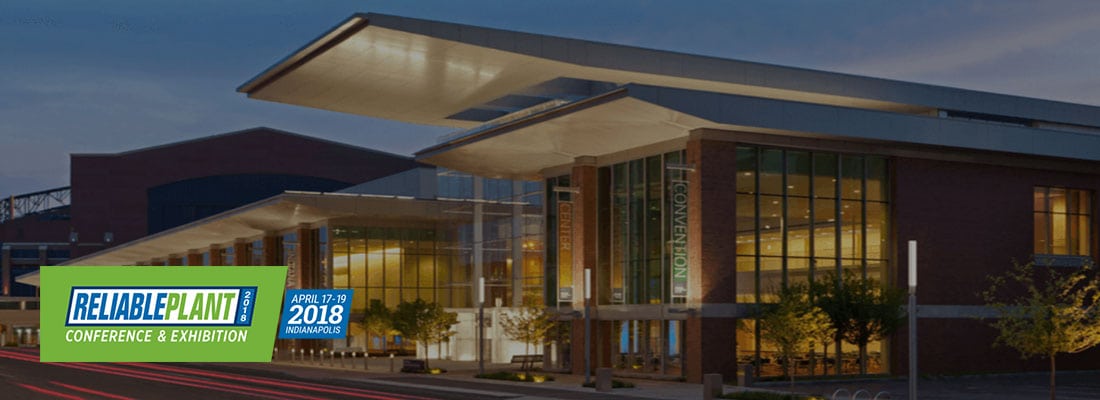 POLARIS Laboratories® experienced succesful networking and visibility at the NORIA Reliable Plant Conference and Exhibition April 17-19. The conference welcomed hundreds of lubrication, oil analysis and maintenance professionals to Indianapolis. POLARIS Laboratories® was proud to be a premier sponsor of the event and provided many opportunities for attendees to network and learn about proven fluid analysis services.