Keep Calm and Sample On

As governments try to slow the spread of COVID-19, businesses face new challenges involving logistics, shipping, border closures and quarantines. However, people are still counting on businesses like yours to continue transporting, producing, powering, mining and operating like normal.

So, where does that leave you? Keep sampling, that’s what!

If you are able, we encourage you to keep calm and keep sampling. After all, many years of feedback from our customers confirms fluid analysis is one of the most cost-effective ways to keep equipment operational, especially because it also saves maintenance technicians time. Knowing how helpful our service is to our customers, POLARIS Laboratories® has put new policies in place to keep workers healthy and our laboratories operational. Click here to read our official COVID-19 message to customers.

We’re Here to Help You

Circumstances may arise that close one of our laboratories or prevent samples from being transported to your normal laboratory. In that case, our “one lab, multiple locations” system will provide you with quality testing and analysis no matter which of our laboratories your samples arrive at. Ship your sample to whichever location you can get it to, and we’ll work quickly to get testing started and results back to you. A list of our six global laboratory locations is listed below. We’ve got you covered.

Indianapolis
7451 Winton Drive
Indianapolis, IN 46268

Houston
10910 W. Sam Houston Parkway N.,
Suite 700
Houston, TX 77064-6314

Salt Lake City
3060 W. California Avenue, Suite B
Salt Lake City, UT 84104

Edmonton
5140 75th Street
Edmonton, Alberta Canada T6E 6W2

Guatemala
Calzada Atanasio Tzul 22-00 zona 12, 01012
Centro Empresarial El Cortijo II, Ofibodega 319
Guatemala City, Guatemala

Poznan
ul.Rubież 46H, 61- 612
Poznan, Poland

We will all face challenges with this crisis, but we can overcome them by working together. POLARIS Laboratories® is here when and where you need us.

Proven Impact. Proven Uptime. Proven Savings.
Let us prove it to you.

Published March 24, 2020

How to Optimize Your Asset Health

The average asset manager runs an average of approximately 10,000 hours on the asset before it’s sold. So, you’ve had your asset for a while, but it has come time to sell it. Yet, you wonder how much life is left on that asset? If you keep it for another 10,000 hours, you can save a lot of money in replacement costs and maintenance. Your asset has run well, you know its maintenance history and you ask yourself do I really need to sell it?

Deciding whether to repair or sell

Many fleets run equipment to about 80 percent of their life expectancy then sell off. But, did you know you can incorporate filter debris analysis to determine equipment reliability at that 80 percent life expectancy? If an issue is found, you can proceed with a rebuild/repair or they can sell. Things to consider when making the decision to sell:

  • Did you buy your asset used?
  • How was your asset’s maintenance history prior to you buying it?
Utilizing filter debris analysis

You can utilize filter debris analysis (FDA) to determine how your asset is and how it’s holding up. Here are a couple of recommendations how to incorporate FDA into your program, depending on the estimated life expectancy:

0-20% You could characterize this as break in or, in the case of used equipment, the baseline of your equipment. What is the wear pattern in the first 20% of your usage of the asset? Submitting three filters with oil samples on regular intervals can give you a pattern.
20-80%  Recommended to test only when wear metal trends are increasing, or you see a significant jump in wear metals
80%>  This is what is referred to a senior asset. Submitting three filters with oil samples on regular intervals can give you a pattern. Then review to determine retesting interval based on results of the FDA results. You may find you need to sell your asset before significant maintenance will occur, or you may find your asset has plenty of life on it.
See what’s being caught in your filter

FDA is a great tool to add to your asset reliability toolbox. It compliments fluid analysis testing by seeing not just the data circulating in the oil, but what is being caught in the filter. This data is crucial to understanding the reliability of your equipment.

See how one company was able to to save more than $250,000 by performing the testing and avoiding gearbox replacements.

Is filter debris analysis something you want to start performing on your asset? Contact your account manager or custserv@eoilreports.com to add it to your program.

Proven Impact. Proven Uptime. Proven Savings.
Let us prove it to you.
Published March 18, 2020

Managing Your Fleet in Real-Time

Maintenance managers in the construction industry have more information available at their fingertips regarding the health and risk of their equipment than ever before. Real time information regarding equipment location, operating conditions, component temperatures, fault codes and a host of other telematics and on-board sensors data. This information is not just raw data, but is converted to useful information, including alerts, dashboards, charts and graphs allowing informed maintenance decisions.

Fluid Analysis Adds Value

We all know the value of a successful fluid analysis program and how, when implemented and ran correctly, can reveal the earliest stages of abnormal component wear and help determine the optimal drain intervals. Fluid analysis is the leading science for non-invasive testing available for a predictive maintenance program.

So why have you not incorporated your fluid analysis results with the other information you are collecting?

Connections are Happening

Imagine if you had, at your fingertips, an electronic copy of the latest operators walk -around report which indicates ‘low coolant level’, in addition, the engines on-board sensors reveal excessive engine temperature, and you also have your latest engine oil analysis report showing high level of sodium and potassium (which is a sure indicator of coolant in the engine oil).

Would it not be of great benefit to have all this combined information easily available? Just think of the value in not only deciding if the equipment should be shut down immediately or allowed to run, but think of the value regarding the insight of the maintenance actions / repairs that need to be taken!

So, back to the question, why is your fluid analysis data not part of the real time information you are focusing on?

Getting Connected is Easy

Today, with POLARIS Laboratories’s integration solution, DataConnect, your fluid analysis data is syncing directly to your CMMS is just an email away. Perhaps you would like the laboratory to work with your third-party telematics service provider for the development of the dashboards, charts and graphs you would like to see, we can do that. In today’s connected world, it only makes sense to integrate all the available data, including your fluid analysis!

Connect your account manager or custserv@eoilreports.com with your interest in this no-cost service we provide for our customers.

Proven Impact. Proven Uptime. Proven Savings.
Let us prove it to you.

Published February 5, 2020

Oil Analysis + Asset Reliability

Equipment Reliability

A well-applied, managed fluid analysis program becomes a major tool in maintaining your equipment in tip-top condition. While it is an additional cost, fluid analysis can pay dividends in keeping the equipment running longer, minimizing repairs and decreasing downtime. Lubricating oil is the most common of the fluids analyzed (click here to see how oil analysis can impact your overall equipment reliability), but there are other equipment fluids just as important that should be considered for analysis: coolant, diesel fuel and greases. Testing all the lubricants and fluids that run through your system can provide a complete picture of what’s going on – and can identify potential problems before they become catastrophic.

In order to establish a great fluid analysis program, you need to start by partnering with a strong, certified laboratory that can analyze all these fluids, and with ample experience in interpreting the results.

Going Beyond the Analysis Report

Your sample data can be utilized to determine trends, as well as wear rates that will impact equipment scheduled maintenance, repairs and overhauls. Your laboratory partner should also assist you with best practices to establish a strong and complete fluid analysis program. Learn more tips for managing an effective fluid analysis program below:

Managing Your Program

Proven Impact. Proven Uptime. Proven Savings.
Let us prove it to you.

Published January 14, 2019

6 Steps to Effective Program Management

Today’s oil analysis capabilities offer a great deal more than just monitoring component health. With today’s technology, along with performing the proper tests, we can monitor the condition of the oil, see if it is suitable for continued use, reduce the amount of used oil disposal, adjust maintenance intervals and strategies, adjust component replacement schedules, improve forecasting and budgeting and increase component life hours.

So how can we be sure to maximize the return on investment from oil analysis?  Well, in my opinion, I believe it needs to encompass the following six steps to be a “world class – best practices” fluid analysis program.

1. Selecting a Quality Laboratory

  • Accurate, reliably and timely
  • Certifications and accreditations
  • Consistent turnaround time
  • Testing capabilities
  • Relevancy of maintenance recommendations
  • Information management tools
  • Facility locations

2. Determine Program Goals

  • What are the goals? Is it to extend oil drain intervals, reduce failures, extend equipment life expectancy, control maintenance and lubrication costs, just to name a few
  • Whatever the goal(s), if you do not establish these goals upfront, and do not have the appropriate testing set up to match these goals, your program will never reach its full potential

3. Create Detailed Equipment List

  • Equipment list information should be submitted to the laboratory before oil samples are ever submitted for analysis
  • Consider the following when compiling the list: Unit Type, OEM, Model Number, Lubricant Manufacturer, Lube Type/Grade, Filtration Type/Size, Sump Capacity and Sampling Interval
  • Read more about adding and edit equipment in HORIZON® here.

4. Identify Resources Available

  • Data Manager – a “gate keeper” to manage and store the data, who ideally is a person with good computer and internet skills
  • Sampler – an “oiler” who is trained on sampling devices/techniques, selects the appropriate testing, takes representative samples at specified intervals, and follows the proper procedure for submitting all of the required information along with the sample to the laboratory

5. The Importance of Time

  • Once taken, sample(s) should be shipped immediately to the laboratory
  • Upon receiving the laboratory report, findings must be evaluated and work order(s) issued, so data analyst’s recommendations will be acted upon as soon as possible, and then findings are communicated back to the laboratory

6. Report to Management

  • Management speaks in the language of “dollars and cents”, so you need to communicate the “savings” to upper management in terms of reduction in oil costs, uptime reports, failure reductions, etc., and ultimately perform/document cost savings due to oil analysis. Read more about finding that “Aha” moment and realizing ROI here.

Find out more about our solutions to effectively managing your program.

Maximize asset reliability and regain control of your production schedules with an effective fluid analysis program by POLARIS Laboratories® . . . it costs so little to protect so much.

Proven Impact. Proven Uptime. Proven Savings.
Let us prove it to you.
Published October 22, 2019


Tips for Pulling a Fluid Sample for Analysis

From oils to coolants, from coolants to grease – we all have our own methods for pulling a sample. But are you truly getting the best representative sample to send for testing? An accurate, representative sample will get you the most reliable sample results, so you can take the correct maintenance action. Want to learn more about best practices for pulling a sample?  See below for some tips:

Oil and Coolant Samples

There are several methods for pulling oil and coolant samples including a vacuum pump, probing valve and a pushbutton method.

  • Tips for using a Vacuum Pump Method
    • Use to pull samples from a dipstick or non-pressurized system
    • Pull a sample when equipment is at or close to normal operating temperature
    • Make sure the tubing is long enough to reach the middle of the reservoir tank
  • Tips for using a KST Series Probing Valve Method
    • Use with valves installed on a pressurized system with a minimum of 4 psi to a maximum of 1000 psi
    • Pull sample when equipment is at or near normal operating temperature
    • Wipe the valve clean with a dry and lint-free cloth
    • Flush at least 3 times into a “waste container” under the valve to purge stagnant oil and debris.
    • Fill the sample bottle bottle approximately 3/4 full
  • Tips for using a KP Pushbutton Sampling Valve Method
    • Use with valves installed on a pressurized line with a minimum of 4 psi to a maximum of 100 psi
    • Pull sample when equipment is at or near normal operating temperature
    • Remove protective valve cap and wipe opening with a dry and lint-free clean cloth
    • Flush at least 3 times into a separate container and then dispose of the waste oil
    • Fill the sample bottle bottle approximately 3/4 full

For full, step-by-step instructions for taking an oil sample or a coolant sample with these methods, view our technical bulletins or view our Fluid Analysis Sampling and Submission video.

Fluid Analysis Sampling and Submission

Grease Samples

There are two methods for collecting grease samples including a standard grease sampler device or a T-Handle.

  • Grease Sampler Method
    • Each kit comes with a plunger, syringe, spatula and grease sampler used collect your sample
    • Collect grease from the component and fill syringe
    • Use the syringe to fill the grease sampler
  • T-Handle Method
    • Use this method to collect a representative sample when a spatula can’t reach the active zone
    • Attach the grease sampler to the T-Handle tool
    • Measure the appropriate depth of the sample by inserting the locking knob into the proper hole
    • Fully insert the grease sampler and T-handle into the component until the tee contacts the housing face

For full, step-by-step instructions for taking a grease sample with a grease sampler or using the T-Handle tool, view our technical bulletins or view our demonstration videos below.

How to Take a Grease Sample with a Grease Sampler

How to Take a Grease Sample with a T-Handle

After collecting your sample, apply the bar code sticker to the sample bottle/container, submit your sample information online and ship the sample in to the laboratory nearest you for processing and testing.

Proven Impact. Proven Uptime. Proven Savings.
Let us prove it to you.
Published September 17, 2019

Eliminating Costly Equipment Downtime

In the construction industry, we see harsh operating conditions, extreme load variations and high-dollar costs with equipment replacement. That’s why fluid analysis a key to meeting the high demands of your customers – on schedule.

Heavy-Duty Equipment Environments

Construction equipment is often exposed to extreme, uncontrollable environmental factors for long periods of time, yet is still expected to maintain optimal performance levels. Contamination and wear are imminent and can halt production in a heartbeat, when left unchecked.

Condition Monitoring

Monitoring the condition of both the fluid and the unit through fluid analysis identifies wear-causing contaminants and their effect on component performance. Monitoring the condition of coolant along with engine oil creates a clearer picture of what’s occurring in the engine. Sampling frequency should be based on the unit’s criticality to production, as well as the costs involved in replacement or repair.

Read more about our solutions and testing recommendations for the construction industry:

Maximize asset reliability and regain control of your production schedules with an effective fluid analysis program by POLARIS Laboratories®. It costs so little to protect so much.


Proven Impact. Proven Uptime. Proven Savings.
Let us prove it to you. 

Published  June 11, 2019


Celebrating 20 Years

As an innovative leader in asset management, reliability and fluid analysis, POLARIS Laboratories® celebrates two decades of accomplishments, successes and innovative solutions we’ve brought to our customers – all while continually saving their equipment.

The beginning

In 1999, we first opened our doors as an oil analysis laboratory, with a mission to provide excellence in oil testing, analysis, tribology expertise, data and recommendations. Our first laboratory was in Greenwood, Indiana and in 2002, we moved to the northwest Indianapolis area and have called that area our home since. In that time, we’ve grown from five to more than 200 employees (in seven global laboratory locations) – who strive every day to meet (and exceed) customer expectations.

20 Years in 5 Minutes

Watch the video to see highlights of our history, accomplishments and our plans for the future.

Our values

Our core values have remained the same throughout our 20 years, with an emphasis to convey to our customers that saving your equipment is more than just sending your sample into our laboratory and getting the results back. What continues to save equipment is customers using the recommendations we provide to take action, establish trend history and effectively manage their maintenance and reliability programs.

What it means

20 years of being the leading fluid analysis provider in the industry has amounted to 48,439 pieces of equipment and $253,575,289 saved for our customers. See below for a quick glance of a few POLARIS Laboratories® stats:

Looking forward

With our eyes on the future, we will continue to focus on providing our customers with the greatest quality of service, accurate and timely analysis results, specialty testing and innovative data integration solutions. We’re expanding our testing and analysis capabilities to include grease, we’re advancing our HORIZON® data management platform and we are increasing adoption of our game-changing solution for sample data automation and integration called DataConnect.

Cheers to 20 more!

View the full press release.

Proven Impact. Proven Uptime. Proven Savings.
Let us prove it to you. 

Published May 7, 2019

Expose What’s in Your Filters

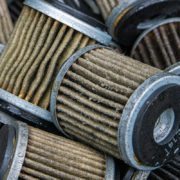
Oil filters are designed to filter out potential contaminants, but the debris that is caught in the filter can help bridge the gap and tell you what’s really causing wear and tear in your system. Filter debris analysis (FDA) analyzes that debris. It helps identify harmful contaminants and wear-causing particles and mechanisms not detected by traditional oil analysis. FDA is preformed by the following laboratory tests:

  • Analytical Ferrography
  • Micropatch
  • Elemental Metals by ICP
  • Acid Digestion
  • Gravimetric Solids

Watch the video to see how we perform FDA at POLARIS Laboratories®.

1. Analytical Ferrography

  • Identifies particles by metallic or non-metallic and shape and color
  • Analyzes particles through a microscope to determine source of wear particles
  • Digital images of particles are included within the analysis report from the data analyst

2. Micropatch

  • Particles are identified and qualified as contaminates
  • Most particles detected by the micropatch test are too small to be detected through routine testing; therefore often times, micropatch testing is recommended after oil analysis is performed.

Analytical ferrography and micropatch tests are conducted underneath a powerful microscope and are often vital in determining wear particles and contaminates not seen by the human eye and not detected by field oil analysis.

3. Elemental Metals Analysis: Detects particles less than 8-10µ and reports data on 24 elemental metals.

4. Acid Digestion: Identifies large particles accumulated in the filter.

5. Gravimetric Solids: Determines total solids in filter based on mass.

The Next Level

Filter debris analysis takes elemental analysis to the next level to determine particle size and type of wear. FDA also allows you to perform root cause analysis of wear to detect early stages of component failures and in turn, helps extend the life of your components.

Discover more about Analytical Ferrography and Micropatch testing by reading this Technical Bulletin.

Proven Impact. Proven Uptime. Proven Savings.
Let us prove it to you. 

Published May 2, 2019

A Connected World: Fluid Analysis is No Exception

We live in a connected world. Our daily lives involve hundreds of interactions with data and technology so why should your fluid analysis program be any different? How you submit samples, receive results, manage test data and take action on maintenance recommendations will determine your program’s ROI. In turn, this affects the uptime and Total Cost of Ownership (TCO) of the equipment you operate.

We are all going through a technological revolution, so it is more important than ever to understand how our devices and The Industrial Internet of Things (IIoT) can be integral to your fluid analysis program.

One System: Smarter Actions

From a maintenance management perspective, viewing oil analysis results from an individual machine on the same screen as its vibration readings and data from sensors allows the engineer to react quicker to the recommendations, assess the bigger picture and understand that one set of results confirms another. This creates huge efficiencies and results in smarter, more accurate maintenance actions being performed. In turn, it leads to improved uptime, an increase in ROI returns and a reduction in the Total Cost of Ownership of the equipment being monitored.

A Solution

POLARIS Laboratories® has joined the technology revolution and is helping you get there, too. With our integration feature, DataConnect, internal data systems communicate and transfer your sample data and results back and forth on an hourly basis from HORIZON® so your own CMMS or SAP system is accurate, up-to-date and in the correct format at all times.

Part of a Routine

Most CMMS or maintenance management programs are utilized at point of application during daily plant walk-rounds, in sample taking or planned maintenance actions. This means there is a growing requirement to integrate the sample taking procedure into your internally-operated system to reduce the number of applications and processes used.

Your system working in conjunction with the laboratory’s system will enable you to use your own software to submit samples and ensure that the information is as accurate as possible (as with our mobile app) and performing all the duties in a ‘single screen’. Knowing when a sample should be taken and receiving the notification is vital for improving compliance and optimizing your fluid analysis program. In addition, having all of this information in a single program not only adds value to the program, but creates huge efficiencies in daily maintenance and reliability tasks.


Proven Impact. Proven Uptime. Proven Savings.
Let us prove it to you. 

Published April 29, 2019