Tips for Pulling a Fluid Sample for Analysis

From oils to coolants, from coolants to grease – we all have our own methods for pulling a sample. But are you truly getting the best representative sample to send for testing? An accurate, representative sample will get you the most reliable sample results, so you can take the correct maintenance action. Want to learn more about best practices for pulling a sample? See below for some tips:
Oil and Coolant Samples
There are several methods for pulling oil and coolant samples including a vacuum pump, probing valve and a pushbutton method.
- Tips for using a Vacuum Pump Method
- Use to pull samples from a dipstick or non-pressurized system
- Pull a sample when equipment is at or close to normal operating temperature
- Make sure the tubing is long enough to reach the middle of the reservoir tank
- Tips for using a KST Series Probing Valve Method
- Use with valves installed on a pressurized system with a minimum of 4 psi to a maximum of 1000 psi
- Pull sample when equipment is at or near normal operating temperature
- Wipe the valve clean with a dry and lint-free cloth
- Flush at least 3 times into a “waste container” under the valve to purge stagnant oil and debris.
- Fill the sample bottle bottle approximately 3/4 full
- Tips for using a KP Pushbutton Sampling Valve Method
- Use with valves installed on a pressurized line with a minimum of 4 psi to a maximum of 100 psi
- Pull sample when equipment is at or near normal operating temperature
- Remove protective valve cap and wipe opening with a dry and lint-free clean cloth
- Flush at least 3 times into a separate container and then dispose of the waste oil
- Fill the sample bottle bottle approximately 3/4 full
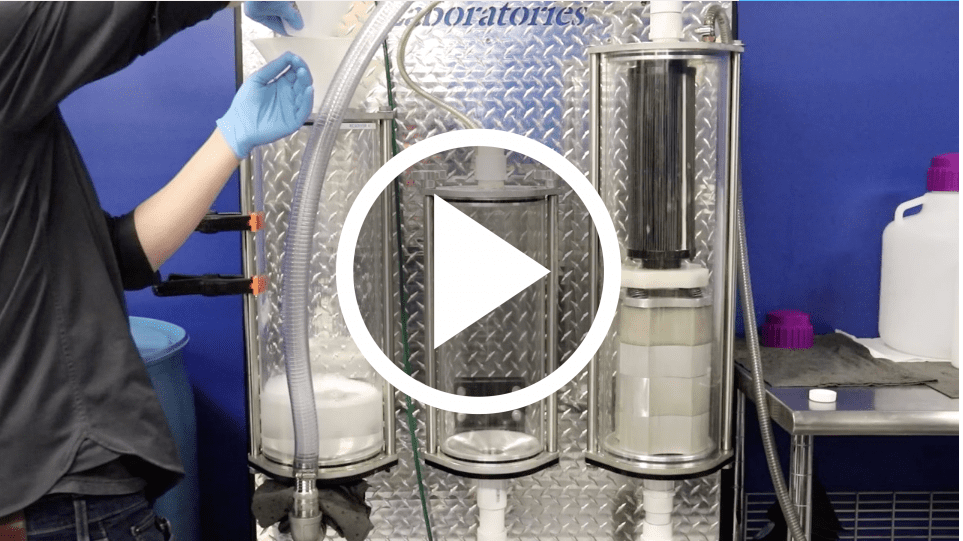
For full, step-by-step instructions for taking an oil sample or a coolant sample with these methods, view our technical bulletins or view our Fluid Analysis Sampling and Submission video.
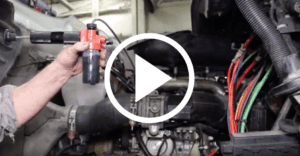
Fluid Analysis Sampling and Submission
Grease Samples
There are two methods for collecting grease samples including a standard grease sampler device or a T-Handle.
- Grease Sampler Method
- Each kit comes with a plunger, syringe, spatula and grease sampler used collect your sample
- Collect grease from the component and fill syringe
- Use the syringe to fill the grease sampler
- T-Handle Method
- Use this method to collect a representative sample when a spatula can’t reach the active zone
- Attach the grease sampler to the T-Handle tool
- Measure the appropriate depth of the sample by inserting the locking knob into the proper hole
- Fully insert the grease sampler and T-handle into the component until the tee contacts the housing face
For full, step-by-step instructions for taking a grease sample with a grease sampler or using the T-Handle tool, view our technical bulletins or view our demonstration videos below.
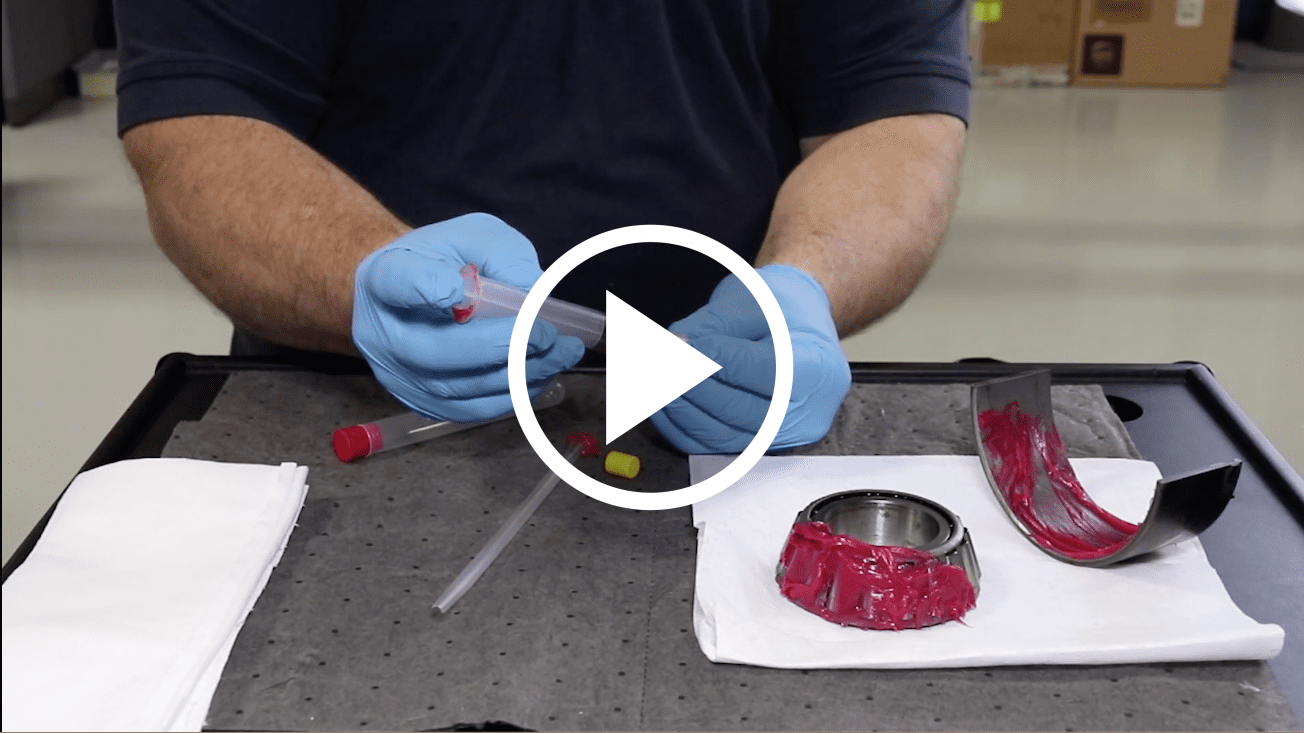 How to Take a Grease Sample with a Grease Sampler |
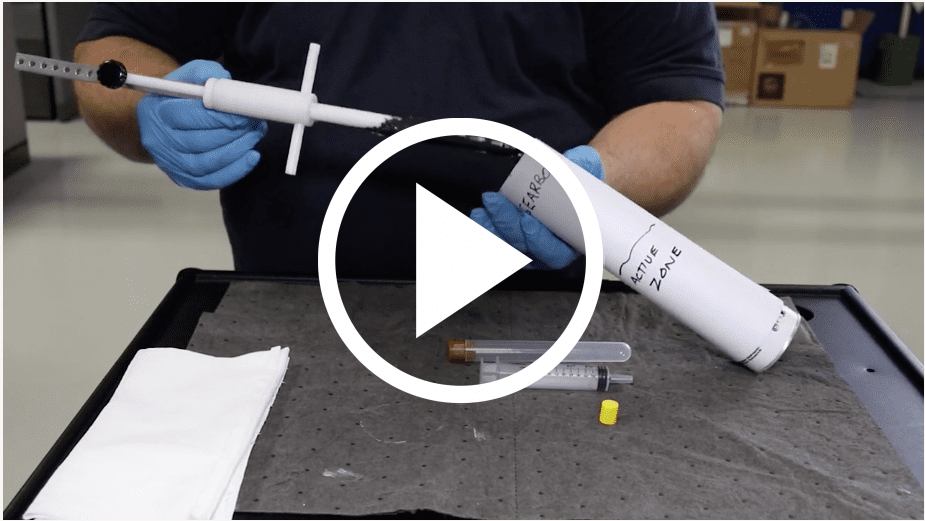 How to Take a Grease Sample with a T-Handle |
After collecting your sample, apply the bar code sticker to the sample bottle/container, submit your sample information online and ship the sample in to the laboratory nearest you for processing and testing.
Proven Impact. Proven Uptime. Proven Savings.
Let us prove it to you.