Revolutionized Maintenance Training at INTEGRATE

Where can you find education and training designed to give you the tools you need to see success along your reliability journey?

The answer: at the 2023 Reliability Summit | INTEGRATE. 

We’ve revolutionized our annual maintenance training conference to provide all-encompassing training on every aspect of your fluid analysis program. From expanding your use of the HORIZON® platform, to understanding how to grow your program, learning how sampling can be made easier, to increasing understanding of result interpretation, to eliminating silos by integrating fluid analysis data into your maintenance management system, INTEGRATE is the one place you need to be.

View this year’s line up of speakers and learning sessions

In one trip to Indianapolis in October, you and your maintenance teams can gain new ideas, insights and knowledge to kick your maintenance into high gear and see your reliability program reap the benefits of effective, impactful fluid analysis.

Gain New Perspectives

Not only will you gain education, but you’ll also gain new perspectives. During this 2-day exclusive event, hosted by POLARIS Laboratories® at The Alexander in Indianapolis, you’ll have the chance to:

  • Meet one-on-one with your account representative
  • Ask subject matter experts your questions
  • Learn what others are doing to improve their reliability program
  • Network with fellow maintenance professionals to learn and grow from their experiences

See Operations in Action

When you attend INTEGRATE, you get more than education through learning sessions, you get a first-hand look at not one, but two facilities through exclusive tours – and a chance to see inside POLARIS Laboratories’ headquarters laboratory in Indianapolis.

Cummins Augmented & Virtual Environmental Lab

Experience a tour of Cummins technical center and environmental lab and see what Cummins engineers and scientists are creating, testing and evaluating to prepare for the future of manufacturing. See processes and devices, including 3D printers, tomography x-ray systems and Cummins’ use of virtual reality.


U.S. Aggregates Facility & Mine Tour 

Get a glimpse of U.S Aggregates’ 460-acre facility and see a glimpse into their mining operations. See how U.S. Aggregates mines and processes limestone, while getting a first-hand look and feel of a raw material reduction with the use of explosives.


POLARIS Laboratories® 

This tour gives you a first-hand look inside our state-of-the art laboratory and headquarters facility in Indianapolis. From the time your sample hits the facility doors, to laboratory testing, to data analysis and customer support, and everything in between, this tour gives you an exclusive look into our laboratory daily operations.

These tours have limited spots, first come first served – register early if you want a seat on the tour. See the available tours and information here.

Discover New Solutions

Our annual training conference would not be possible without our event sponsors. We’ve teamed up with several industry solutions providers (lube manufacturers, filter solutions, sampling supplies, data integration) to give you tools to advance your programs and expand your maintenance practices. Each sponsor will have an exhibitor booth at the conference as well. Please feel free to stop by their booths to see what they have to offer your program!

It’s All Here in Indianapolis

I’ll leave you with this question, where else can you find lube manufacturers, OEMs, testing experts, reliability professionals, integration solution providers and everyone in between? At INTEGRATE October 2-4 in Indianapolis.

From the Data Analyst: How Sample Information Affects Limits and Analysis

Two questions our Data Analysis team often receives from fluid analysis customers are “What information is necessary to analyze our samples?” and “Why is this information so important?”

Whether your sample is defined as a grease, diesel fuel, lubricant or coolant, there are complex interpretation factors accounted for each test result of the respective application. Aside from establishing the appropriate testing slate applied to a fluid, test limits may also vary and be comprised of SAE, ISO, POLARIS Laboratories®, OEM, industry charter and/or fluid manufacturer standards. Due to these reasons, it is imperative to supply as much relevant equipment and fluid information as accessible to your laboratory when submitting the sample for testing.

Here are a few scenarios… Without fluid information, a laboratory may not be able to see abnormal fluctuations for additive content or viscosity. The fluid’s basicity may become essentially depleted prior to detection, or the acidic levels may be too high for neutralization efforts. Without the specific equipment model, a laboratory may have to rely on generic data points to extrapolate typical wear accumulation. These limits may be too aggressive or not aggressive enough for the type of equipment tested. These are all exact scenarios we have previously experienced with customers.

For example, we may factor the following information when establishing statistical trends for wear metal content, lubricant properties and interpreted recommendations:

  • Equipment Type (e.g. engine)
  • Specific Application (e.g. diesel)
  • Equipment Manufacturer (e.g. Cummins)
  • Equipment Model (e.g. ISX)
  • Industry Type (e.g. logistics/transportation)
  • Lubricant Manufacturer (e.g. Chevron)
  • Lubricant Product (e.g. Delo 600 ADF)
  • Lubricant Viscosity (e.g. 15W40)
  • Filter Type (e.g. Full Flow)
  • Filter Micron Rating (e.g. 10 micron)
  • Sump Capacity (e.g. 14 gallon)
  • Time on Lubricant (e.g. 13,598 miles)
  • Time on Equipment (e.g. 124,600 miles)

While some equipment manufacturers have a ‘fixed’ wear limit table for operational guidelines, laboratories typically provide a more objective and literal statistical significance of normal wear accumulation. These statistics may reduce unnecessary calls for maintenance, which would otherwise lead to costly downtime or premature use of materials.

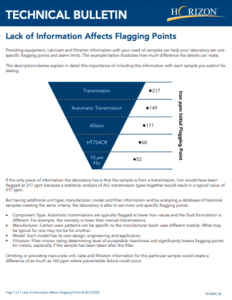
Read more in the Technical Bulletin

If you are unsure what information may be required to appropriately identify abnormal trends for your equipment samples, reach out to the laboratory for a list of the requisites and additional guidance. To receive an improved return on investment out of a lubricant, fuel, or coolant maintenance program, avoid delays or guesswork the laboratory may experience due to absent sample information.

Sampling Devices: Find the Right One for Your Program

Sampling devices are used to pull samples of lubricant, coolant or fuel out of system components. There is a range of sampling devices to fulfill specific needs, but they can be grouped into two basic categories – 1) vacuum pumps and 2) installed sampling devices.

Vacuum Pumps

vacuum pump

Vacuum pumps pull fluid from a component’s reservoir. Disposable tubing is fed through the pump and into a sample jar screwed onto the pump. The other end of the tubing is used to reach into the component’s reservoir. The vacuum from the pump pulls fluid out of the reservoir and into the sample jar without contacting the pump itself. Oil residue in the tubing would contaminate future samples, so it must be thrown away. The pump itself never touched the fluid and can be reused without cleaning.

Installed Sampling Devices

Commonly referred to as “valves,” small sampling devices are installed on components to create a permanent, easily accessible port for drawing samples. Using valves to pull fluid is typically faster than using vacuum pumps alone. The valves also minimize the chances of environmental contamination entering the sample or the fluid system. These permanent devices collect the most representative samples possible in the least amount of time. The two most common types differ based on if the system is pressurized or not.

Push Button (4-100 PSI) – Pushing a button on the device opens the port. The pressure from the system pushes fluid through the port and into an open sample jar held below the valve.

push button valve

Push Pin (4-1000 PSI) – Inserting a “pin” or “needle” into the device opens the port. System pressure or a vacuum pump moves fluid through tubing attached to the pin. A cap is screwed onto the sample jar to secure the other end of the tube when a vacuum pump isn’t used. The pin, tubing and cap cannot be easily cleaned and must be thrown away.

push pin valve


Installed Sampling Devices Save Time And Money

One vacuum pump can draw samples from multiple components, but it pulls samples slower than an installed sampling device. Generally, the reduced sampling time pays for the device and its installation after five samples.

So what are you waiting for? Order your sampling devices (i.e. Push Button or Push Pin) via the HORIZON Store, install them as soon as possible to start saving even more money with your fluid analysis program!

Maximize asset reliability and regain control of your production schedules with an effective fluid analysis program by POLARIS Laboratories® . . . it costs so little to protect so much.

Proven Impact. Proven Uptime. Proven Savings.

Let us prove it to you.

Published March 16, 2023

Diesel Fuel Analysis: Importance of Fuel Type

When submitting a diesel fuel sample for laboratory testing and analysis, it can be easy to assume that all diesel fuel is essentially the same and that it is not important to identify its grade. However, failure to do so can result in inaccurate test results and unnecessary alerts due to differences in the grades of the diesel fuel.

Distinguishing Diesel Fuel Types

According to ASTM D0975-22a, “Standard Specification for Diesel fuel,” the major types of diesel fuel are #1 and #2, with three grades each depending on the amount of sulfur present. Diesel fuel #2 the most common and is a general purpose fuel with a wide variety of applications. In the absence of special conditions, this is generally the most applicable fuel to use as it is cost-effective and offers better fuel mileage vs diesel fuel #1. Diesel fuel #1 is a special purpose fuel with a lower volatility that can withstand a lower temperature before gelling. This can be useful in lower temperatures and it can be used to make winter diesel blends.

In addition, both types of fuel are split into three grades each based on parts per million of sulfur content.

  1. S5000 (sometimes called high sulfur fuel) contains a maximum of 5000 ppm of sulfur
  2. S500 (sometimes called low sulfur fuel) contains a maximum of 500 ppm
  3. S15 (sometimes called ultra low sulfur fuel or ULSDF) contains a maximum of 15p pm of sulfur
    1. Learn more about verifying ppm specs in ultra low sulfur diesel fuel here

Differences in Diesel Fuel Testing

The differences between #1 and #2 diesel fuel can be seen in several laboratory tests. In particular, diesel fuel #1 will have lower results for Viscosity, Cloud Point, Pour Point and Distillation in relation to diesel fuel #2. Correctly identifying the fuel type will ensure that the analysis results are compared to the correct standards during analysis. This will help to determine if the fuel conforms to its specification, remove potential false alarms and ensure that the reported condition of the fuel is accurate.

Download our Complete Testing List here for more information on fuel testing offered by POLARIS Laboratories®

You can read more on the effects of ultra-low sulfur diesel fuel on viscosity in our Technical Bulletin here

Proven Impact. Proven Uptime. Proven Savings.

Let us prove it to you.

Published March 10, 2023

Coolant Condition Monitoring: Comparing Testing

Include Cooling Systems in Regular Maintenance

Coolant testing is an important aspect of maintaining the cooling system. Part of your normal maintenance schedule should include inspecting the cooling system at every maintenance interval. During operation, the cooling system must 1) circulate coolant, 2) transfer heat away from the engine and 3) dissipate the heat through the radiator to the atmosphere before circulating back through the engine again. These three functions must occur efficiently to maintain the proper operating temperature. If the lubricant is showing increased wear, increase in viscosity and or oxidation, the cooling system should be tested. Cooling system health effects how well the equipment will operate and ensures the ability for the fluids in the system to protect the equipment metals from damage.

To verify the coolant properties are adequate, testing becomes a critical part of system maintenance. Field testing conducted on-site should be a used as a screening tool to determine if laboratory testing is required earlier than scheduled. Laboratory testing is a critical part of any fluid analysis program in addition to field testing.

Field Testing & Laboratory Testing

Field testing includes monitoring visual characteristics of the coolant using test strips to determine corrosion protection levels, pH and or freeze point. A handheld refractometer for testing glycol percent is another useful tool. Some limitations with field testing include: coolant with a normal appearance could be misleading, low precision and limited scope of testing. Most laboratory testing will report results in parts per million and detect various materials smaller than the eye can see. Laboratory testing can be used to determine the validity of concerns with corrosion of system metals, hard water contamination, early degradation breakdown of the glycol and other chemical properties. Laboratory testing is typically recommended to be conducted twice a year for normal use engines (Spring & Fall) and every quarter for high-hour or extreme duty engines.

There’s more to coolant analysis than testing coolant formulations – it’s about identifying problems within the cooling system that can be detrimental to engine performance and lead to premature engine failure. Below are some advantages and disadvantages of using coolant test strips and laboratory testing.


Proven Impact. Proven Uptime. Proven Savings.

Let us prove it to you.

Published February 9, 2023

Sulfur Content in Diesel Fuel: Limits and Regulations

EPA Regulations and The Clean Air Act

Since the 1990s, diesel fuel quality has been an essential topic of discussion due to the increased regulations that the U.S. EPA has implemented over the years as a result of the Clean Air Act (CAA). One of the main goals of this Act was to set and achieve National Ambient Air Quality Standards (NAAQS) in every state. The 1990 CAA amendments were later revised to include the issuance of technology-based standards that require the maximum degree of reduction of emissions of hazardous air pollutants. New regulations meant engine manufacturers and diesel fuel producers would have to work together to determine how to meet the new standards best.

Effects of Emission Regulations on Diesel Fuel

The most easily attainable and regulated fuel property that the EPA regulated in the 90’s was sulfur content. Historically, ASTM standards have limited sulfur content to .5% (wt.). A few years later, in October 1993, a limit for Low Sulfur diesel fuel was introduced as 500 ppm = 0.05% (wt.) to facilitate the particulate sulfate reductions to meet the emissions standards.

Fast forward to June 2006, the maximum sulfur level in the U.S. was reduced to 15 ppm (Ultra Low Sulfur Diesel) for on road (highway) diesel engines and fuel supplies and was subsequently adopted by all nonroad, locomotive and marine (NRLM) diesel fuel and equipment in 2014. In addition, the regulations prompted engine manufacturers to deploy catalyst-based emission control devices, such as NOx absorbers and Diesel Particulate Filters (DPF), to meet new diesel emission tier standards.

Sulfur emission reduction has also been an important subject for the maritime industry. In 2010, marine standards that were previously exempt were further reduced from previous levels to 1,000 ppm within the Sulfur Emissions Control Areas (SECAs) for North America and the U.S. Caribbean Sea. In January 2020, new international rules put forth under the International Maritime Organization also reduced the global sulfur limit (outside SECAs) in marine fuels to 0.5% or 5000 ppm (down from 3.5%), and the change is expected to have a ripple effect throughout the fuel industry.

The U.S. Energy Information Administration (EIA) has noted that the change in sulfur limits has wide-ranging repercussions for the global refining and shipping industries, as well as petroleum supply, demand, trade flows and prices. From market disruptions from the COVID pandemic and today’s economic pressures on buying and selling bulk diesel fuel to meet demands, monitoring the sulfur content of your diesel fuel is still important decades after emission standards were implemented.

Reducing sulfur content in diesel fuel has placed a new demand on diesel engines and emission control systems in operation today. Factoring in the aging and foreign fuel supplies in circulation and storage, along with the ever-changing regulations means ensuring that equipment fuel supplies meet the required specifications is now necessary.

Check out our recommended testing for diesel fuels here.

Proven Impact. Proven Uptime. Proven Savings.
Let us prove it to you.

Published February 3, 2023

Impact of Cold Temperatures on Your Cooling System

Coolant analysis can shed light on developing internal problems and catch concerns early before harmful problems can occur. Making the proper adjustments, when needed, is critical for maintaining proper cooling system performance.

How do Temperatures Affect Coolant?

When outside temperatures drop, proper freeze protection is required to avoid freezing or lack of coolant flow within the cooling system. When coolant freezes, it is most likely due to improper water-to-glycol ratio in the cooling system. Freezing can cause cracking and damage to the engine block and/or cooler allowing coolant and lubricant to mix. Once lubricant and coolant mix, further damage to the asset will occur leading to an expensive unexpected repair.

Finding the Proper Glycol Mixture

The proper glycol mixture with the water is crucial. Testing and maintaining the proper dilution provides a lower freeze protection, while also maintaining proper coolant properties. Water by itself has a freeze point of 32 degrees Fahrenheit (0 degrees Celsius). Using only water or too much water dilution will lower other coolant protection properties and can lead to system corrosion and lower than desirable pH control. However, too much glycol can cause the coolant to become too viscous, slow down coolant flow within the system and an over-saturation of corrosion inhibitors resulting in a precipitation concern. Plugging and/or inadequate coolant flow will impact proper protection for the cooling system and increase the time needed for the engine to reach proper operating temperatures. Lubricant not reaching proper temperatures allows for more metal-to-metal contact and engine wear concerns.

Routinely Test Your Cooling System to Avoid Problems

Overall, roughly 40% or so of preventable engine failures occur due to the cooling system not functioning properly. Most concerns in the cooling system are created by improper maintenance of the cooling system and coolant in service. Coolant chemistry reactions occur due to mechanical issues, coolant properties not being maintained and/or contamination of the system.

Learn more and find answers to your coolant testing and analysis questions here.

A proper fluid analysis program should include testing all fluids in the asset to have a better understanding of the fluid and equipment health. With trend analysis, you can catch concerns easier and faster and be able to take action on the proper recommendations to identify and address the issue before you have expensive, unexpected equipment downtime.

Winter temperatures should not keep your equipment out of service. Reach out today and pull a coolant sample to take out the guesswork out of knowing if the coolant in the system meets requirements for properly protecting your cooling system.

Proven Impact. Proven Uptime. Proven Savings.
Let us prove it to you.

Published January 10, 2023

Are You Certified in Oil Analysis?

Today’s oil analysis capabilities offer a great deal more than just monitoring component health. With today’s technology, along with performing the proper tests, we can:

  • Monitor the condition of the oil
  • See if it is suitable for continued use
  • Reduce the amount of used oil disposal
  • Adjust maintenance intervals
  • Adjust component replacement schedules
  • Improve forecasting and budgeting
  • Increase component life hours

With all of this in mind, it begs the question, are you able to maximize the return on investment from your oil analysis program? I believe the answer to this question would be for you to become certified as an Oil Monitoring Analyst (OMA I) via the Society of Tribologists and Lubrication Engineers (STLE).

What is an Oil Monitoring Analyst (OMA I)?

Predictive maintenance professionals who oversee the oil analysis program for a shop/plant would be suited for OMA I certification. At POLARIS we call this person a Program Champion. At POLARIS we believe the single most important ingredient in a successful oil analysis program is the Program Champion inside it. OMA I certification might also be beneficial for other members of a maintenance team to obtain as well (i.e. mechanics, operators, engineers, etc.). Anyone with the following core responsibilities would be a viable candidate for OMA 1 certification:

  • Responsible for oil sampling
  • Reviews oil analysis reports and performs the correct tests
  • Maintains overall care of equipment and maintenance actions

Becoming OMA I Certified

OMA I certification is obtained by scoring 70 percent or higher on the designated exam that standardizes the body of knowledge for an Oil Monitoring Analyst. Once obtained, the certification is valid for three(3) years, after which individuals are required to recertify to maintain their OMA I status.

OMA I Exam Topics

  • Sampling
  • Application/Test Methods
  • Data Interpretation
  • Troubleshooting
  • Lubrication Fundamentals

Requirements

  • 16 hours of training in oil analysis-related courses, which may include company training programs
  • One year of experience utilizing oil analysis in the field of lubrication

Society of Tribologists & Lubrication Engineers (STLE)

So what are you waiting for? Get your Oil Monitoring Analyst I (OMA I) certification today. Visit the STLE website for a list of recommended reading materials for certification.

Proven Impact. Proven Uptime. Proven Savings.
Let us prove it to you.

Published December 23, 2022

ATP (Adenosine Triphosphate) Content Testing for Diesel Fuels

Do You Know What’s Happening in Your Diesel Fuel?

Ultra-low sulfur diesel and biodiesel fuel are particularly vulnerable to water contamination during transport and storage. Once water gets into the diesel fuel system, it creates the opportunity for an invasion of microorganisms. Microbes attack the fuel/water interface, where they thrive and multiply. Once established, they embed themselves in a thick layer of slimy deposits, creating several troublesome maintenance problems, including premature fuel filter plugging, clogged injectors, fuel storage tank corrosion, and leakage.

Proactively Detect Potential Microbial Activity

The new ATP (Adenosine Triphosphate) Content Test measures ATP, the primary component found in cells responsible for transferring energy in living organisms. An accurate measurement of ATP within diesel fuel provides a clear indication of when action should be taken to mitigate unwanted, harmful biological growth in the fuel system or tank.

With this new laboratory test, your sample’s results and analysis are are available faster compared to standard turnaround time for bacteria, fungi and mold testing included in basic diesel fuel test packages.

Click to View the ATP  Content Testing Technical Bulletin

If you’re interested in this new test, please reach out to your account manager or email service@eoilreports.com.

Proven Impact. Proven Uptime. Proven Savings.
Let us prove it to you.

Published December 8, 2022

Coming Soon: New Diesel Fuel Sample Bottle

In the coming months, customers who are testing diesel fuel will see a change in their diesel fuel test kits. The kits will include a smaller-sized metal sample bottle (a 500 mL rather than a 750 mL bottle). This new bottle can be used for collecting and sending in diesel fuel samples for all routine diesel fuel testing packages. Through recently implemented changes in diesel fuel testing procedures in the laboratory, the amount of diesel fuel required to perform testing has been reduced.

  • Smaller collection bottle means less diesel fuel from your machine
  • Reduction in the bottle size means lower shipping costs and less environmental waste
  • There will be no changes to test packages or kits, customers will begin to see the new bottle within newly ordered kits


If you have any questions, please reach out to our customer experience team at custserv@eoilreports.com or by phone 1.317.808.3750 (Monday – Friday, 7:30 a.m. – 7:00 p.m. ET)

Proven Impact. Proven Uptime. Proven Savings.
Let us prove it to you.

Published November 1, 2022