Condition-Based Maintenance
Preventative maintenance only occurs when a set intervals of time or usage passes. This leaves equipment problems unaddressed for long periods, which leads to unexpected failures.
True condition-based maintenance programs perform equipment maintenance only when condition-monitoring technologies provide sufficient evidence that the condition of the fluid and/or the equipment merits action. Then maintenance can be scheduled to minimize any disruption to the equipment’s uptime, but it is necessary for technology to prove there is a problem and establish a clear direction for correcting it.
EXAMPLE 1: Diesel engine re-builds are typically done at around 750,000 miles with oil drain intervals around 10,000 miles. Unexpected issues can reduce that interval, including fuel scheduling issues (bad injectors, excessive soot) or coolant contamination (leaks in the engine or the EGR cooler). This creates wear and leads to premature failure. Normal scheduled maintenance every 25,000 miles will spot these issues, but this leads to unscheduled downtime as the unit waits for parts. In the worst-case scenario, a problem develops and causes a failure before the next scheduled maintenance, causing collateral damage to other components.
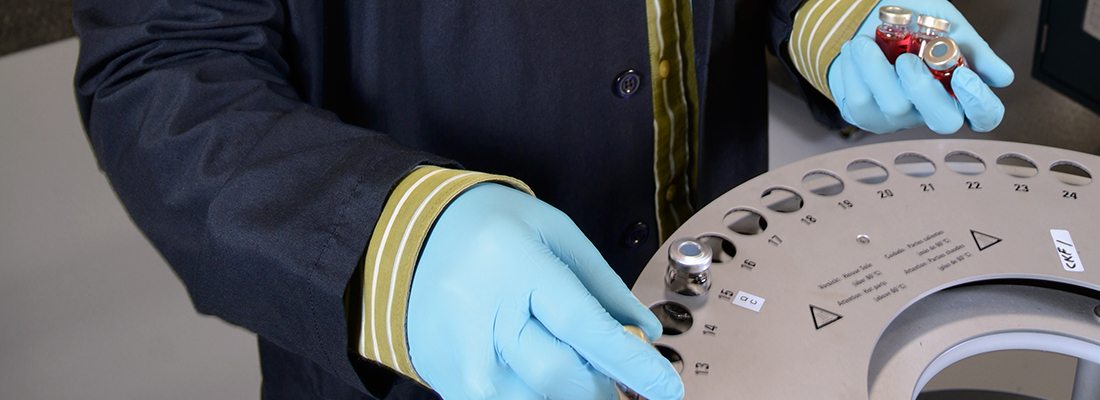
EXAMPLE 2: A typical diesel engine can use a condition-based maintenance strategy and rely on oil analysis trends to optimize drain intervals. When wear, contamination and/or fluid degradation approaches levels that could result in engine damage, the data analysis will recommend to change the oil, resample to verify the result or perform additional diagnostics. This allows parts to be staged for the unit so there is no delay when maintenance is performed. All of this increases the unit’s uptime and can even delay a rebuild.
Benefits of Condition-Based Maintenance
- Operating costs are significantly reduced.
- Extending maintenance and oil drain intervals reduces wrench time and oil consumption.
- Performing the appropriate maintenance on the appropriate unit at the appropriate time increases component life and improves overall fleet management.
- Trending data provides early knowledge of possible failures, allows for scheduled maintenance and drastically reduces unscheduled downtime. This requires changing from a preventive maintenance strategy to a predictive maintenance strategy that identifies and addresses small problems before they develop into catastrophic failures.
- Regularly reviewing trends of condition monitoring results provides more accurate root-cause analysis of preventable failures.
 Need a plan to move your program from interval-based to condition-based maintenance today?
Take a look at our simple 8-week timeline.
Learn more about getting an oil analysis program started with POLARIS Laboratories®.
Proven Impact. Proven Uptime. Proven Savings.
Let us prove it to you.


 It’s easy to become overwhelmed when trying to understand the multitude of variation among formulations, but it can actually be broken down quite simply. Take a look at our


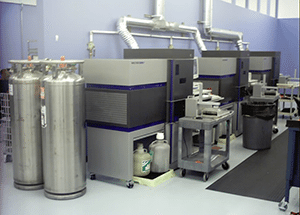
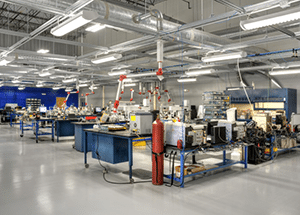
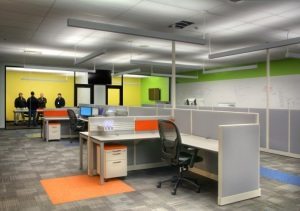 Our commitment to Lean principles isn’t limited to just the laboratory. Our entire team in the Indianapolis laboratory is embracing the many advantages of transparency, flexibility and open communication. To foster greater collaboration and idea sharing, we designed the new facility with low cubicle walls and glass walls in most conference and break rooms. This open environment facilitates collaboration and team work so we can provide better results and solutions for our customers.