Advancements in Detecting and Measuring Soluble Varnish

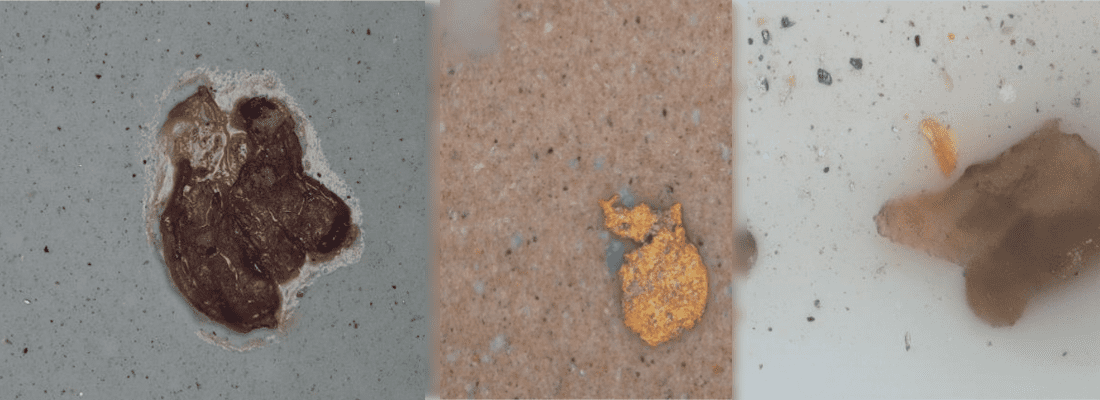
As part of our mission to improve the quality of our interpretation, POLARIS Laboratories® is constantly performing statistical analysis on our test results to evaluate typical parameters and establish thresholds for our tests. We are proud to announce improvements made to our new MPC method, which has the potential to measure soluble varnish in turbines, hydraulics and compressors using R&O formulations. This new method was introduced to our existing MPC method (ASTM D7843) as a tool for customers to more proactively identify and correct their oil’s potential to develop both soluble and insoluble varnish.

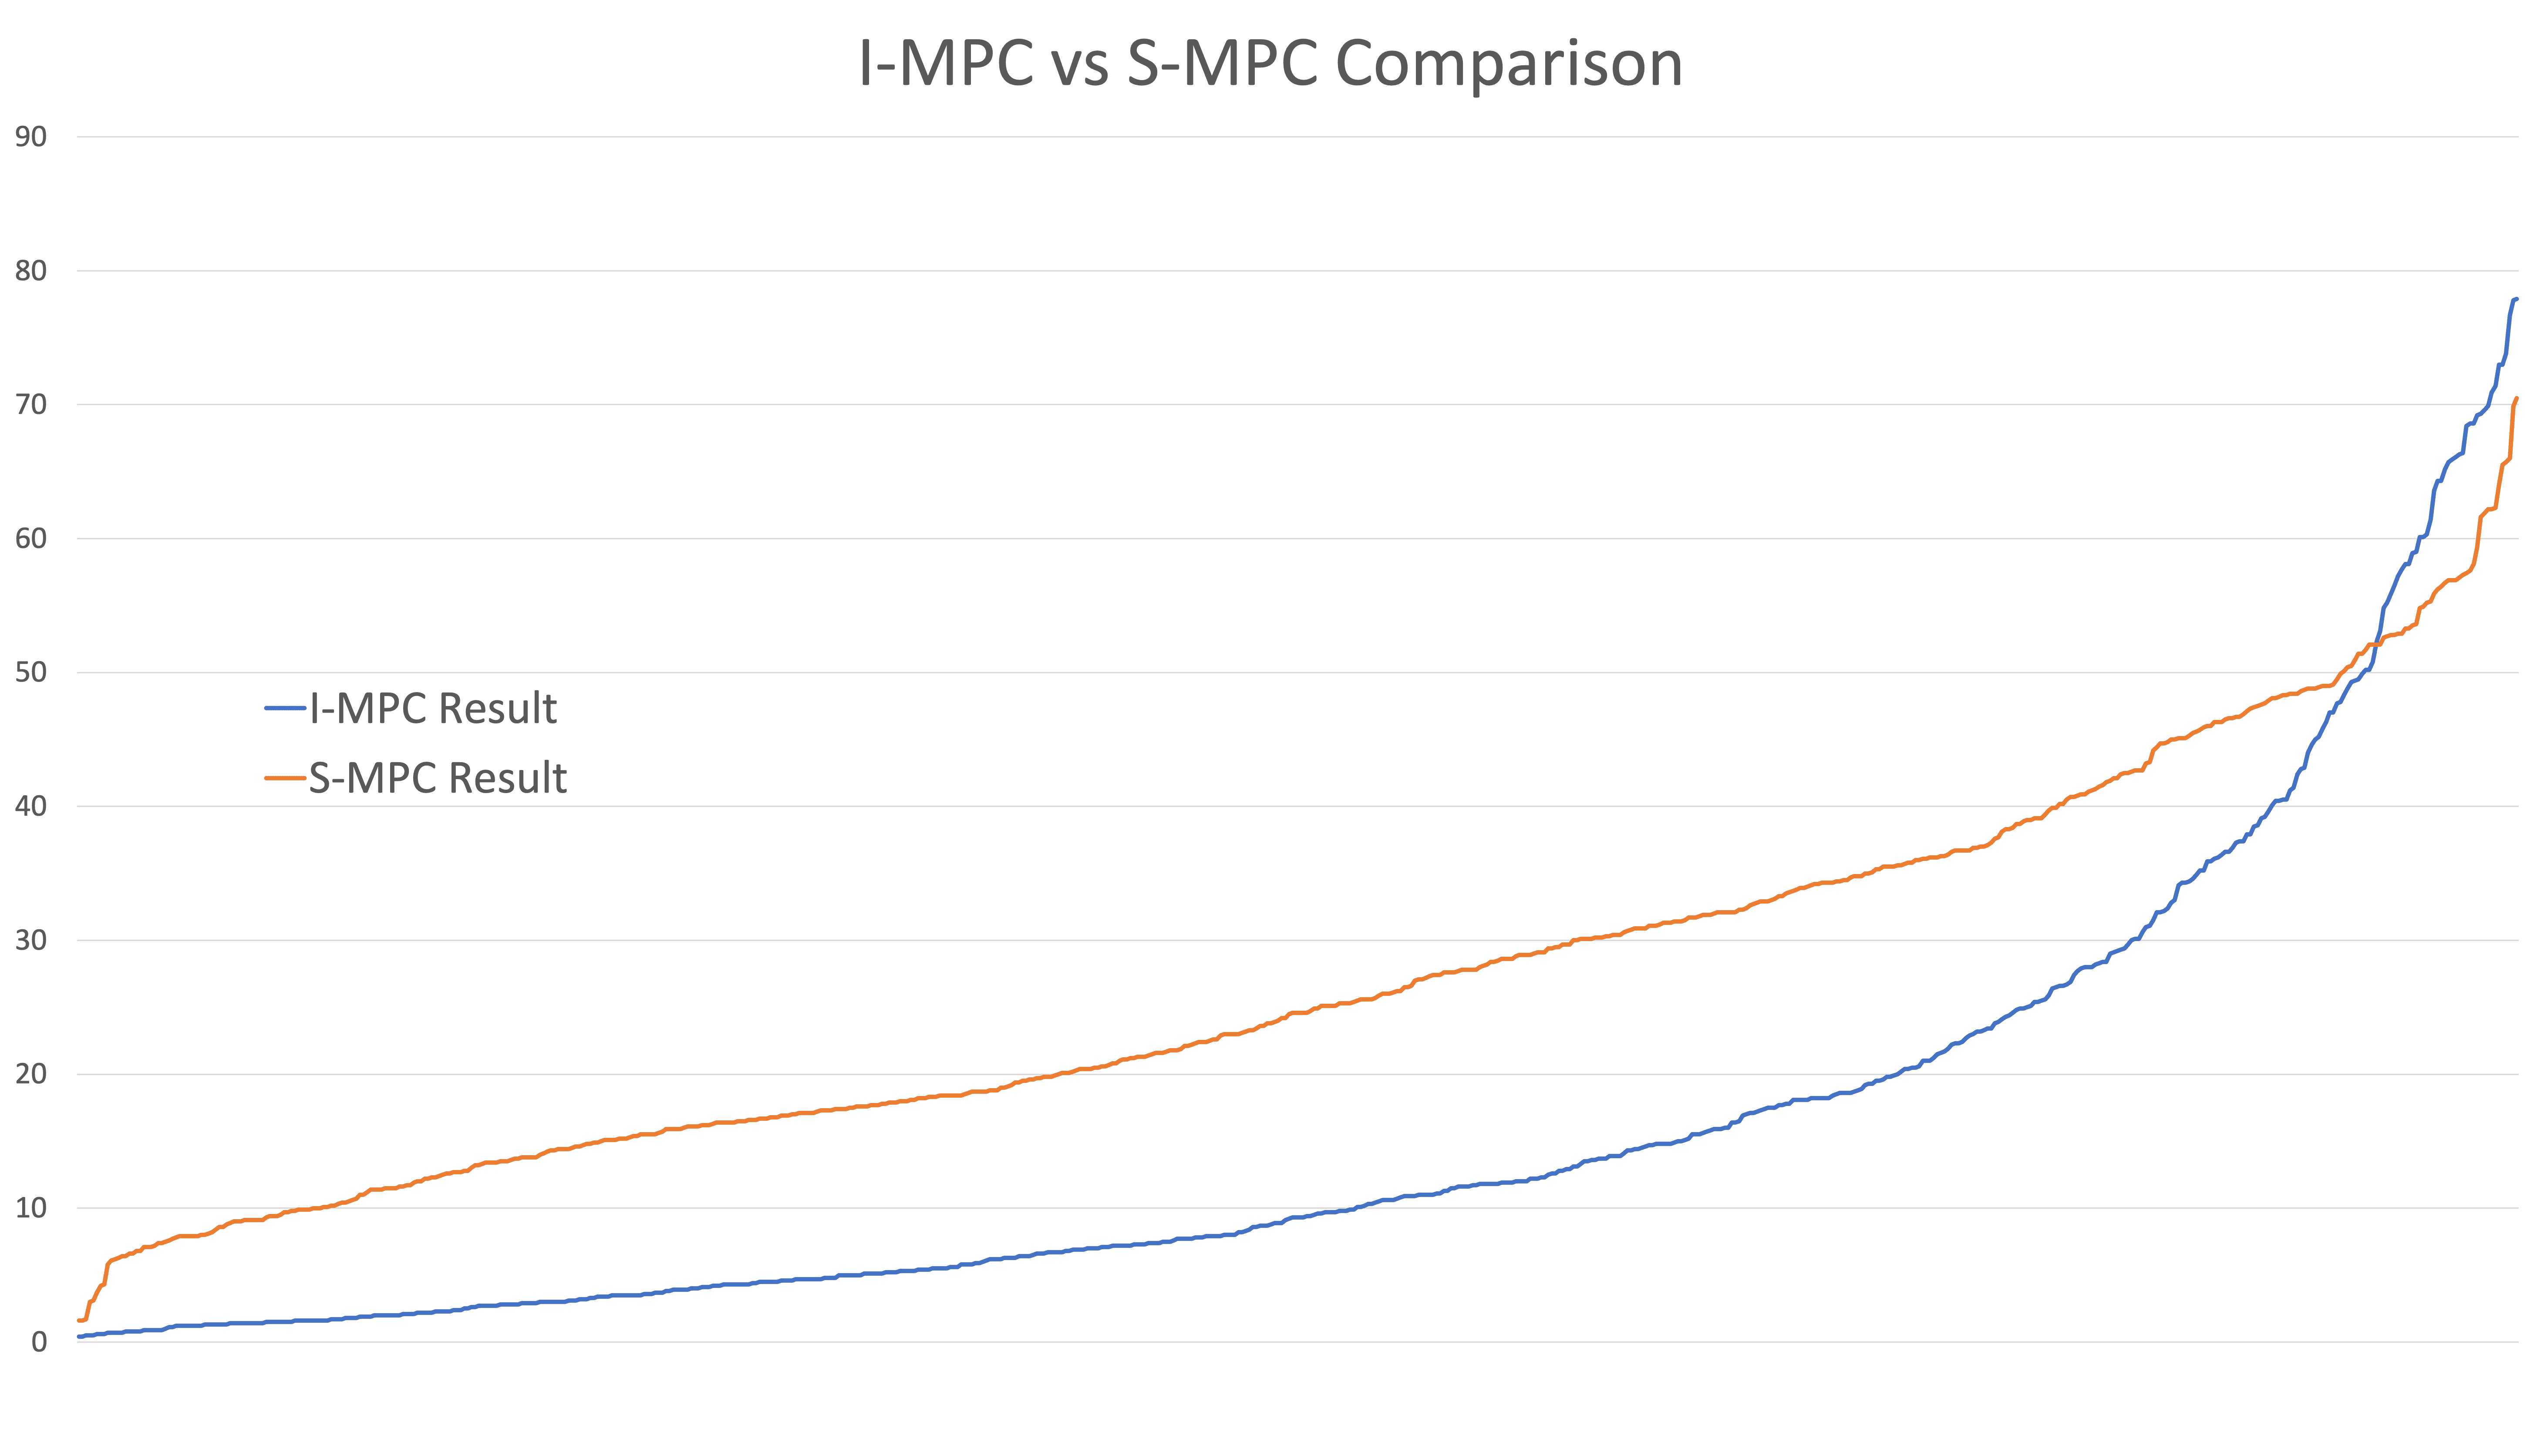
While our new method was introduced with the same severity range as ASTM D7843, we have now collected enough data to confidently establish new limits based on the same statistical methods used for other ASTM tests. Our findings show that the new method tends to produce higher values, and for this reason we will begin considering the results abnormal when they exceed a value of 25, whereas the threshold for the original method is 15.

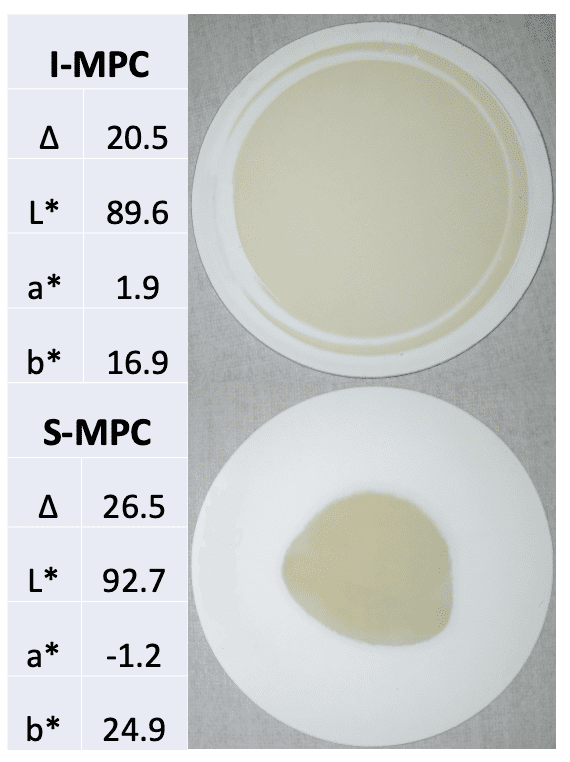
Along with our new MPC method, we also began reporting L*a*b* values to quantify color value. Our findings show that the L value (black to white) has a strong correlation with our original MPC method, and will now be considered “low” when the value is below 75. Similarly, our findings show that the b* value (yellow) has a strong correlation with the new MPC method, so this value will now be considered “high” when it exceeds a value of 35.

As with any other test that has been introduced, we are working to make improvements and understand factors that will influence the results. The new MPC method has the potential to measure soluble varnish, however there are many other variables that can influence the results. We will now start listing these variables on the report if the new MPC method is high, and will not recommend that any action be taken unless results for the original method are high as well.


POLARIS Laboratories® strives to continually improve our methods and interpretation of the analysis conducted on fluid samples to assist our customers catch varnish contamination sooner, saving more equipment and improving reliability.

Proven Impact. Proven Uptime. Proven Savings.

Let us prove it to you.

Published July 28, 2023

Value of Oil Analysis: Lubricant Manufacturers, Marketers and Distributors

Delivering value through oil analysis separates you from the competition, validates your claims, builds credibility, can help extend oil drains and leads to increased customer satisfaction. If you’re a lubricant marketer or distributor, here are a few values that come along with oil analysis, both for you and your customer.

Talking Oil Analysis: Where to Start

1. An efficient, well-managed oil analysis program is a daily reminder of the service and can help safely extend your drains.

2. Independent laboratory oil analysis validates your claims and builds credibility for your lubricant.

3. New equipment? Oil analysis can find manufacturing defects and maintains warranties that ultimately increase the equipment’s lifecycle.

4. Extending oil drains is a good thing: if a customer wants to extend their oil drains, they’ll either do it with you or someone else.

5. Did you know 40-50% of preventable engine failures can be attributed to the cooling system? Cooling systems have changed dramatically in the last 30 years, and coolants have transformed with them. OAT, HOAT and NAPS formulas have joined conventional coolants, and mixing them together can make both coolants less effective.

6. Identify areas for improved maintenance: finding dirt and water contamination from maintenance problems or poor lubrication storage gives you even more opportunities to help your customers.

7. As an independent laboratory, POLARIS Laboratories® provides all the data analysis and reports, giving you the ability to use fact-based decisions with your customers.

8. Maintaining your profits and providing additional value is always more profitable than dropping prices and hoping to increase volume.

Proven Impact. Proven Uptime. Proven Savings.

Let us prove it to you.

Published July 26, 2023

Revolutionized Maintenance Training at INTEGRATE

Where can you find education and training designed to give you the tools you need to see success along your reliability journey?

The answer: at the 2023 Reliability Summit | INTEGRATE. 

We’ve revolutionized our annual maintenance training conference to provide all-encompassing training on every aspect of your fluid analysis program. From expanding your use of the HORIZON® platform, to understanding how to grow your program, learning how sampling can be made easier, to increasing understanding of result interpretation, to eliminating silos by integrating fluid analysis data into your maintenance management system, INTEGRATE is the one place you need to be.

View this year’s line up of speakers and learning sessions

In one trip to Indianapolis in October, you and your maintenance teams can gain new ideas, insights and knowledge to kick your maintenance into high gear and see your reliability program reap the benefits of effective, impactful fluid analysis.

Gain New Perspectives

Not only will you gain education, but you’ll also gain new perspectives. During this 2-day exclusive event, hosted by POLARIS Laboratories® at The Alexander in Indianapolis, you’ll have the chance to:

  • Meet one-on-one with your account representative
  • Ask subject matter experts your questions
  • Learn what others are doing to improve their reliability program
  • Network with fellow maintenance professionals to learn and grow from their experiences

See Operations in Action

When you attend INTEGRATE, you get more than education through learning sessions, you get a first-hand look at not one, but two facilities through exclusive tours – and a chance to see inside POLARIS Laboratories’ headquarters laboratory in Indianapolis.

Cummins Augmented & Virtual Environmental Lab

Experience a tour of Cummins technical center and environmental lab and see what Cummins engineers and scientists are creating, testing and evaluating to prepare for the future of manufacturing. See processes and devices, including 3D printers, tomography x-ray systems and Cummins’ use of virtual reality.


U.S. Aggregates Facility & Mine Tour 

Get a glimpse of U.S Aggregates’ 460-acre facility and see a glimpse into their mining operations. See how U.S. Aggregates mines and processes limestone, while getting a first-hand look and feel of a raw material reduction with the use of explosives.


POLARIS Laboratories® 

This tour gives you a first-hand look inside our state-of-the art laboratory and headquarters facility in Indianapolis. From the time your sample hits the facility doors, to laboratory testing, to data analysis and customer support, and everything in between, this tour gives you an exclusive look into our laboratory daily operations.

These tours have limited spots, first come first served – register early if you want a seat on the tour. See the available tours and information here.

Discover New Solutions

Our annual training conference would not be possible without our event sponsors. We’ve teamed up with several industry solutions providers (lube manufacturers, filter solutions, sampling supplies, data integration) to give you tools to advance your programs and expand your maintenance practices. Each sponsor will have an exhibitor booth at the conference as well. Please feel free to stop by their booths to see what they have to offer your program!

It’s All Here in Indianapolis

I’ll leave you with this question, where else can you find lube manufacturers, OEMs, testing experts, reliability professionals, integration solution providers and everyone in between? At INTEGRATE October 2-4 in Indianapolis.

From the Data Analyst: How Sample Information Affects Limits and Analysis

Two questions our Data Analysis team often receives from fluid analysis customers are “What information is necessary to analyze our samples?” and “Why is this information so important?”

Whether your sample is defined as a grease, diesel fuel, lubricant or coolant, there are complex interpretation factors accounted for each test result of the respective application. Aside from establishing the appropriate testing slate applied to a fluid, test limits may also vary and be comprised of SAE, ISO, POLARIS Laboratories®, OEM, industry charter and/or fluid manufacturer standards. Due to these reasons, it is imperative to supply as much relevant equipment and fluid information as accessible to your laboratory when submitting the sample for testing.

Here are a few scenarios… Without fluid information, a laboratory may not be able to see abnormal fluctuations for additive content or viscosity. The fluid’s basicity may become essentially depleted prior to detection, or the acidic levels may be too high for neutralization efforts. Without the specific equipment model, a laboratory may have to rely on generic data points to extrapolate typical wear accumulation. These limits may be too aggressive or not aggressive enough for the type of equipment tested. These are all exact scenarios we have previously experienced with customers.

For example, we may factor the following information when establishing statistical trends for wear metal content, lubricant properties and interpreted recommendations:

  • Equipment Type (e.g. engine)
  • Specific Application (e.g. diesel)
  • Equipment Manufacturer (e.g. Cummins)
  • Equipment Model (e.g. ISX)
  • Industry Type (e.g. logistics/transportation)
  • Lubricant Manufacturer (e.g. Chevron)
  • Lubricant Product (e.g. Delo 600 ADF)
  • Lubricant Viscosity (e.g. 15W40)
  • Filter Type (e.g. Full Flow)
  • Filter Micron Rating (e.g. 10 micron)
  • Sump Capacity (e.g. 14 gallon)
  • Time on Lubricant (e.g. 13,598 miles)
  • Time on Equipment (e.g. 124,600 miles)

While some equipment manufacturers have a ‘fixed’ wear limit table for operational guidelines, laboratories typically provide a more objective and literal statistical significance of normal wear accumulation. These statistics may reduce unnecessary calls for maintenance, which would otherwise lead to costly downtime or premature use of materials.

Read more in the Technical Bulletin

If you are unsure what information may be required to appropriately identify abnormal trends for your equipment samples, reach out to the laboratory for a list of the requisites and additional guidance. To receive an improved return on investment out of a lubricant, fuel, or coolant maintenance program, avoid delays or guesswork the laboratory may experience due to absent sample information.

Sampling Devices: Find the Right One for Your Program

Sampling devices are used to pull samples of lubricant, coolant or fuel out of system components. There is a range of sampling devices to fulfill specific needs, but they can be grouped into two basic categories – 1) vacuum pumps and 2) installed sampling devices.

Vacuum Pumps

vacuum pump

Vacuum pumps pull fluid from a component’s reservoir. Disposable tubing is fed through the pump and into a sample jar screwed onto the pump. The other end of the tubing is used to reach into the component’s reservoir. The vacuum from the pump pulls fluid out of the reservoir and into the sample jar without contacting the pump itself. Oil residue in the tubing would contaminate future samples, so it must be thrown away. The pump itself never touched the fluid and can be reused without cleaning.

Installed Sampling Devices

Commonly referred to as “valves,” small sampling devices are installed on components to create a permanent, easily accessible port for drawing samples. Using valves to pull fluid is typically faster than using vacuum pumps alone. The valves also minimize the chances of environmental contamination entering the sample or the fluid system. These permanent devices collect the most representative samples possible in the least amount of time. The two most common types differ based on if the system is pressurized or not.

Push Button (4-100 PSI) – Pushing a button on the device opens the port. The pressure from the system pushes fluid through the port and into an open sample jar held below the valve.

push button valve

Push Pin (4-1000 PSI) – Inserting a “pin” or “needle” into the device opens the port. System pressure or a vacuum pump moves fluid through tubing attached to the pin. A cap is screwed onto the sample jar to secure the other end of the tube when a vacuum pump isn’t used. The pin, tubing and cap cannot be easily cleaned and must be thrown away.

push pin valve


Installed Sampling Devices Save Time And Money

One vacuum pump can draw samples from multiple components, but it pulls samples slower than an installed sampling device. Generally, the reduced sampling time pays for the device and its installation after five samples.

So what are you waiting for? Order your sampling devices (i.e. Push Button or Push Pin) via the HORIZON Store, install them as soon as possible to start saving even more money with your fluid analysis program!

Maximize asset reliability and regain control of your production schedules with an effective fluid analysis program by POLARIS Laboratories® . . . it costs so little to protect so much.

Proven Impact. Proven Uptime. Proven Savings.

Let us prove it to you.

Published March 16, 2023

How to Ensure Optimum Performance of Wind Turbines

With the increase of greener energy production, wind turbines are playing an increasingly important role. It is vital that these energy producing turbines operate at optimum capacity for extended periods of time. To do this, a high level of equipment reliability is critical and, due to remote locations or access difficulties, all maintenance needs to be planned at optimum intervals to ensure maximum uptime and reductions in total cost of ownership (TCO).

The operating fluids inside a turbine, including lubricating oil in gearboxes and hydraulic systems, fluids used in cooling systems and greases all play a significant role in optimizing operation of the wind turbine. All of these operating fluids should be monitored closely to determine the condition of the fluid, identify contamination and measure the levels of wear metals generated within each system.

Monitoring conditions through routine fluid analysis allows you to avoid unplanned downtime and perform necessary maintenance based what is actually happening within the unit rather than on the hours in operation or calendar days. Planned, predictive maintenance will get you to optimum energy production.

See the recommended testing for power generation equipment here.

Proven Impact. Proven Uptime. Proven Savings.
Let us prove it to you.

Published January 5, 2023

Are You Certified in Oil Analysis?

Today’s oil analysis capabilities offer a great deal more than just monitoring component health. With today’s technology, along with performing the proper tests, we can:

  • Monitor the condition of the oil
  • See if it is suitable for continued use
  • Reduce the amount of used oil disposal
  • Adjust maintenance intervals
  • Adjust component replacement schedules
  • Improve forecasting and budgeting
  • Increase component life hours

With all of this in mind, it begs the question, are you able to maximize the return on investment from your oil analysis program? I believe the answer to this question would be for you to become certified as an Oil Monitoring Analyst (OMA I) via the Society of Tribologists and Lubrication Engineers (STLE).

What is an Oil Monitoring Analyst (OMA I)?

Predictive maintenance professionals who oversee the oil analysis program for a shop/plant would be suited for OMA I certification. At POLARIS Laboratories® we call this person a Program Champion. At POLARIS Laboratories® we believe the single most important ingredient in a successful oil analysis program is the Program Champion inside it. OMA I certification might also be beneficial for other members of a maintenance team to obtain as well (i.e. mechanics, operators, engineers, etc.). Anyone with the following core responsibilities would be a viable candidate for OMA 1 certification:

  • Responsible for oil sampling
  • Reviews oil analysis reports and performs the correct tests
  • Maintains overall care of equipment and maintenance actions

Becoming OMA I Certified

OMA I certification is obtained by scoring 70 percent or higher on the designated exam that standardizes the body of knowledge for an Oil Monitoring Analyst. Once obtained, the certification is valid for three(3) years, after which individuals are required to recertify to maintain their OMA I status.

OMA I Exam Topics

  • Sampling
  • Application/Test Methods
  • Data Interpretation
  • Troubleshooting
  • Lubrication Fundamentals

Requirements

  • 16 hours of training in oil analysis-related courses, which may include company training programs
  • One year of experience utilizing oil analysis in the field of lubrication

Society of Tribologists & Lubrication Engineers (STLE)

So what are you waiting for? Get your Oil Monitoring Analyst I (OMA I) certification today. Visit the STLE website for a list of recommended reading materials for certification.

Proven Impact. Proven Uptime. Proven Savings.
Let us prove it to you.

Published December 23, 2022

Program Insights: Time to Make Adjustments and Improvements

How many times have you heard “in these unprecedented times” since 2020? Well the precedent has been set, times have changed and they are not going to change back…

The reality is: labor shortages are requiring staff to become more creative, oil supply has forced companies to extend their drains, equipment availability lead times are so far out that new equipment is not an option (even if you could, interest rates are continuing to rise). In addition to these challenges, parts and service are driving downtimes to be longer and longer. The truth is, these challenges are not going away anytime soon. So, what can you do now to solve some of these challenges?

Your Maintenance Program Isn’t the Same Anymore

You simply cannot hold on to the maintenance program you had in the past. Your program needs to be proactive – even world-class preventive maintenance programs are changing. Programs are finding new ways to drive efficiency, reduce rework and keep expenses down – all while keeping production up. These programs regularly turn to the experts at POLARIS Laboratories® to learn how they can keep being the best.

What Can You Do Today?

Programs that are seeing positive improvements and big impact aren’t making groundbreaking changes, they are making small, incremental changes that result in big impact, such as:

  1. Participating in our extended drain comments program to prolong the life of their oils
  2. Adding sampling valves to equipment to provide an accurate, consistent sample in half the time
  3. Scheduling quarterly Program Enrichment Reviews to learn what issues occur the most and on what pieces of equipment
  4. Discovering new tools and ways to integrate data to drive efficiency and effectiveness

Slow Down to Speed Up

In business it has been said “sometimes you need to slow down to speed up”.  When was the last time you asked for expert advice on how to improve your program? We know how busy you are, we understand the pressures of outside factors on your daily workload. The good news is, even though you may have hundreds of things to worry about and take care of, POLARIS Laboratories® has one focus: your preventive maintenance.

Call us today and talk to our experienced Reliability team. Ask their advice what you can do to make an impact and alleviate your maintenance challenges. They are here to help you implement a better program. As mentioned at the start of this blog, the unprecedented times are now precedented.  Things will only change if we do. Call us at 877-808-3750 or fill out our contact form – we’re here to help.


Proven Impact. Proven Uptime. Proven Savings.
Let us prove it to you.

Get Connected: Data Integration Platform Partnerships

DataConnect, a free service offered by POLARIS Laboratories®, allows customers to integrate their fluid analysis data into their existing maintenance management platform, such as an ERP (Enterprise Resource Planning), CMMS (Computerized Maintenance Management System) or business analytics system. Integrating data allows customers to view critical information within a single platform to make informed maintenance decisions, including auto triggering work orders, online sample data submission, equipment list updates and more.

This service uses a secure Application Programming Interface (API) and is easy for customers that have the time, resources, and skills to pull data from the API and integrate with their existing preferred maintenance management platform. For others, a ‘turnkey’ solution may be desired.

For the ‘turnkey’ solution, this is where POLARIS Laboratories® Integrated Partners come in. The partners, working with POLARIS Laboratories® and the end user, develop the integration from the API and the customer’s system.

Today’s existing integrated partners fall into several different categories:

  • Equipment OEMs
  • Telematics Services
  • Maintenance Service Providers
  • ERP/CMMS service providers
  • On-Board Sensor Providers

If your company falls in to one of the above categories, or any additional category pertaining to equipment reliability and monitoring, we would love to talk with you about becoming an integrated partner. We see this as a benefit of promoting your company and increasing your revenue stream while also promoting the services offered by POLARIS Laboratories®. Most importantly, we see this as providing value-added service solutions to our mutual customers.

If you are interested in learning more about POLARIS Laboratories® Integrated Partner solutions, please contact:

Randy Clark, Manager of Reliability, at rclark@polarislabs.com.

Proven Impact. Proven Uptime. Proven Savings.
Let us prove it to you.

Published May 3, 2022

Go Green with POLARIS Laboratories®: New QR Sample Labels

In the coming months, POLARIS Laboratories® will focus on improving its environmental footprint. With a constant increase of fluid analysis users submitting samples online through HORIZON®, users are less dependent on paper sample label forms to

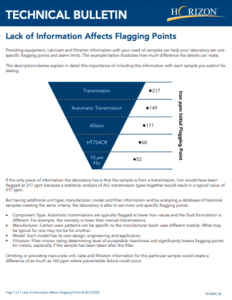
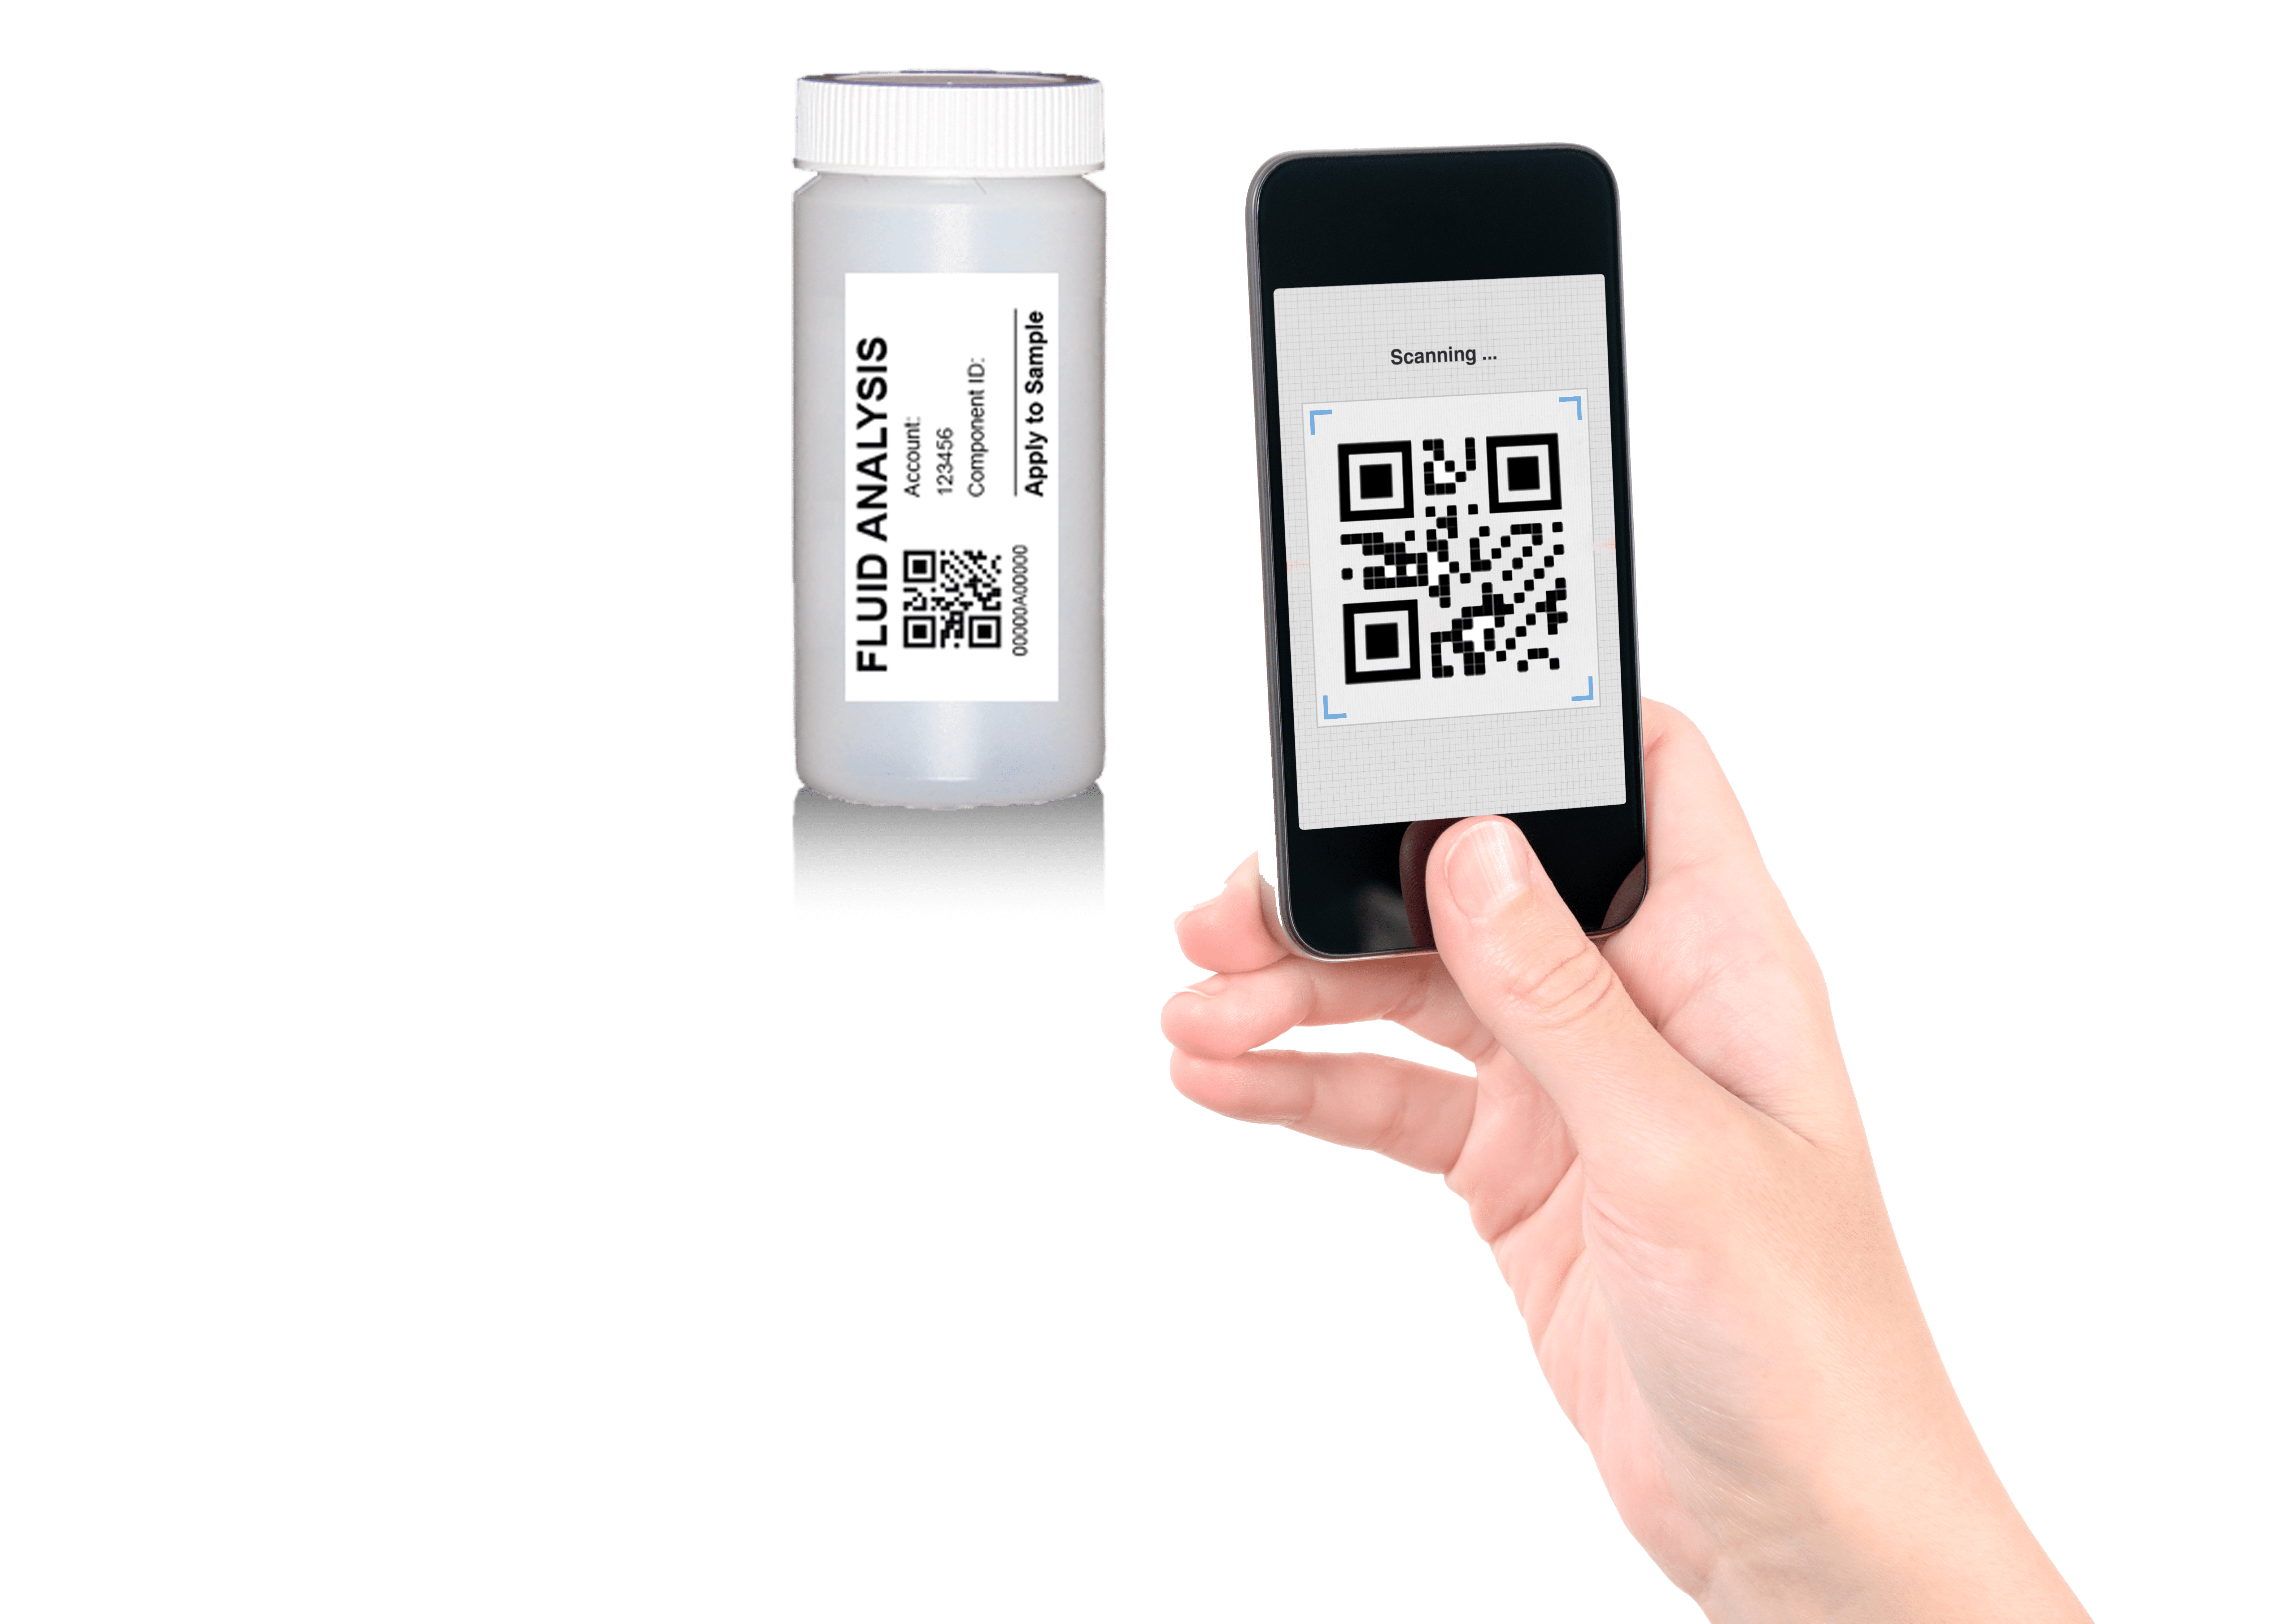
provide the laboratory with equipment, component, manufacturer and fluid information.

As a laboratory, POLARIS Laboratories® operates under a Lean environment. This means we are constantly looking for improvements to eliminate waste – whether it be energy waste or actual paper waste affecting the environment.

Launching in July 2022, as part of our Green Initiative to help protect the planet, POLARIS Laboratories® will provide users the option to order QR-code only sample jar labels. These labels are small 2″ x 1″ labels that function similarly to the sample jar label found on the Sample Information Form today – just without the paper.

See How QR-Code Labels Work

Proven Impact. Proven Uptime. Proven Savings.
Let us prove it to you.

Published April 18, 2022