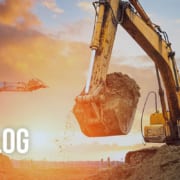
How to Optimize Your Off-Highway Performance

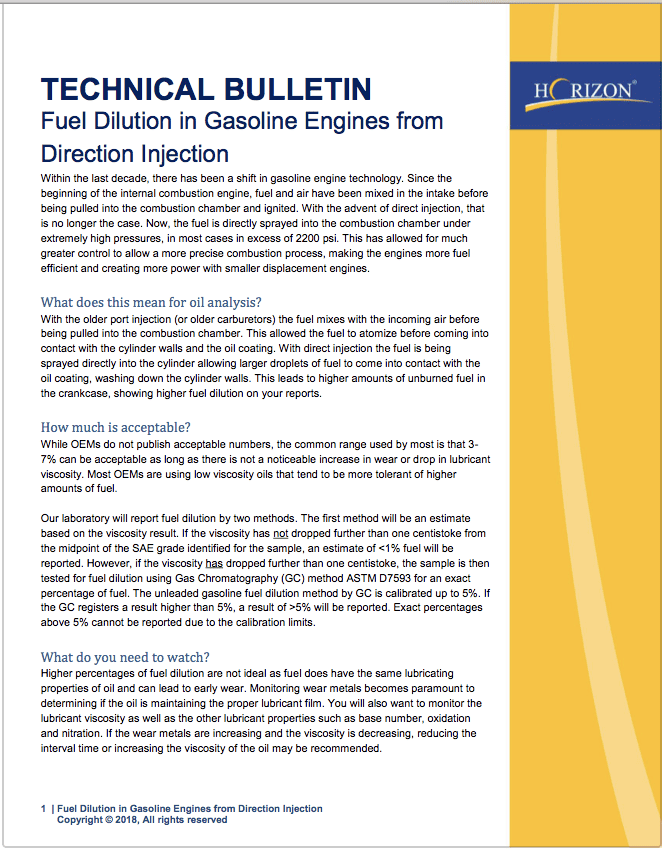
Operating off-highway operations means exposing your expensive equipment to harsh conditions daily, including moisture, abrasives and temperature. Despite these harsh conditions, the equipment is still expected to perform at high levels and complete jobs on time. When it comes to off-highway equipment, there are four major issues to be aware of that could affect your equipment performance:
- CONDITIONS | operating in extreme environmental conditions can cause excessive wear and shorten the life of your equipment
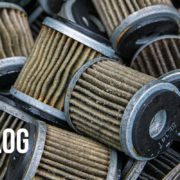
- DIRT | dirt and silica can contaminate your oil, causing excessive wear on the engine
- WATER | water can wreak havoc on the operating performance and cause severe damage to the equipment
- OVERHEATING | operating under the above circumstances will result in overheating of the equipment- causing your equipment to fail
Breakdowns usually occur far from any mechanics shop, meaning repairs are slow, expensive and they put projects behind schedule. Be aware of these four issues to optimize the performance and preserve the life of your off-highway equipment – and be able to predict problems before they occur.
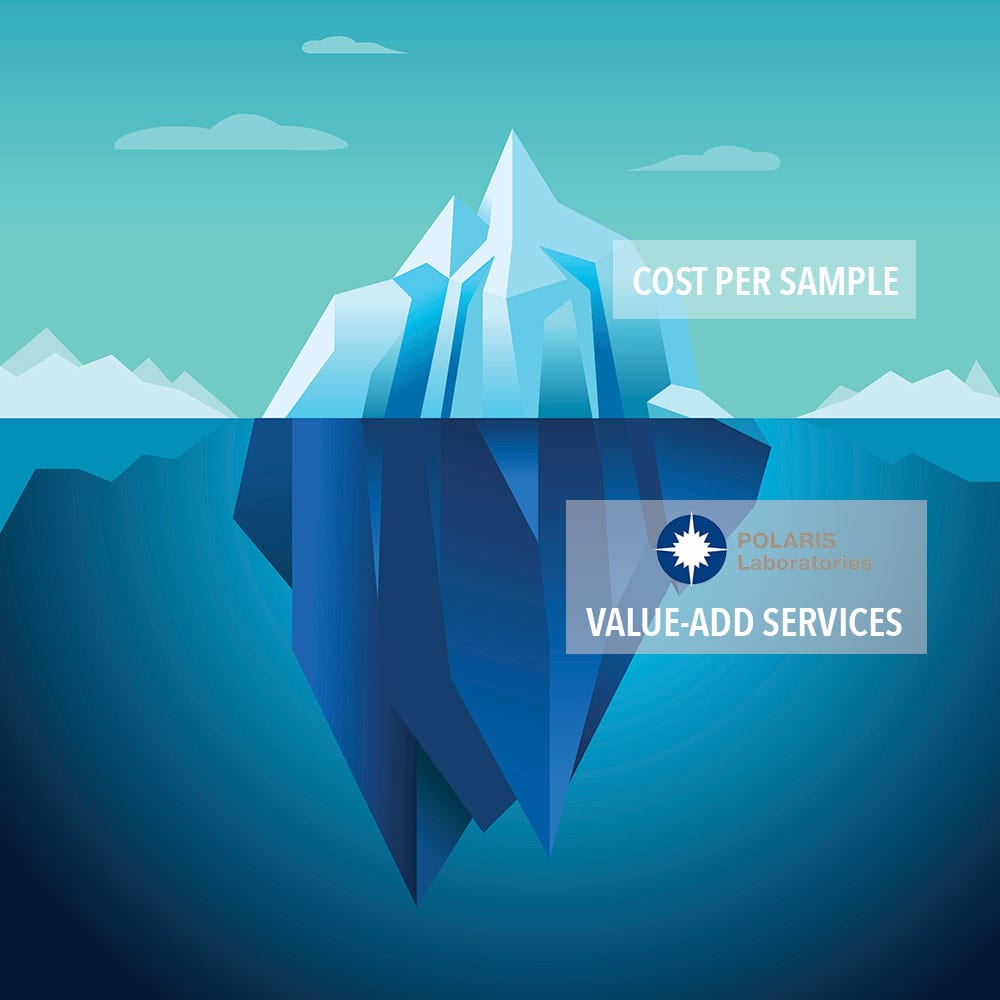
Proven Impact. Proven Uptime. Proven Savings.
Let us prove it to you.


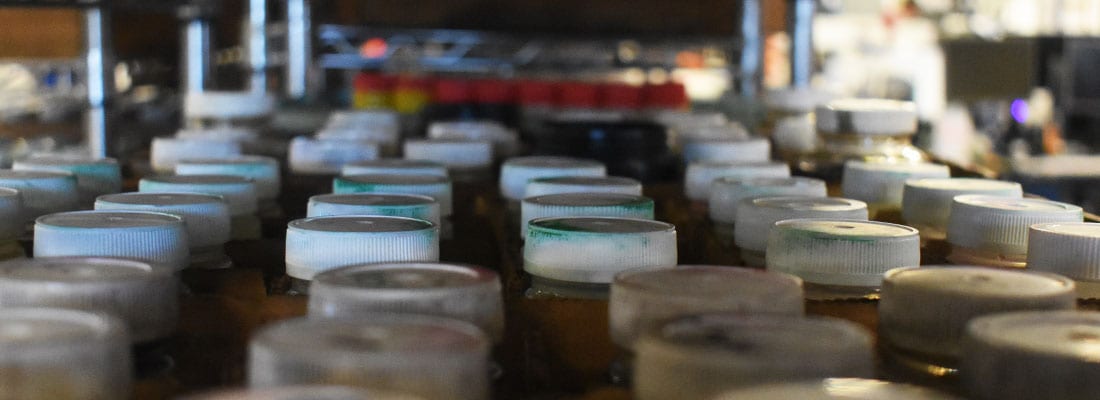 So you’ve successfully taken your oil sample, what next? Ship it to the laboratory, of course. It’s important to ship the sample as soon as possible after you collect it – don’t let your samples pile up and ship a large amount at a time.
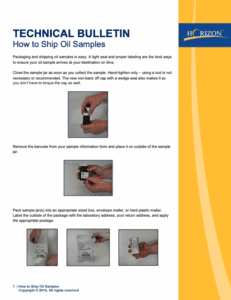


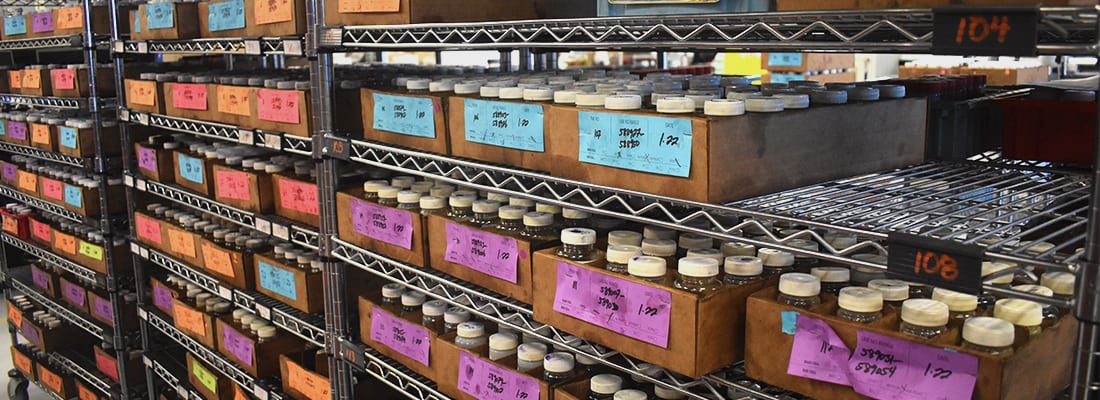
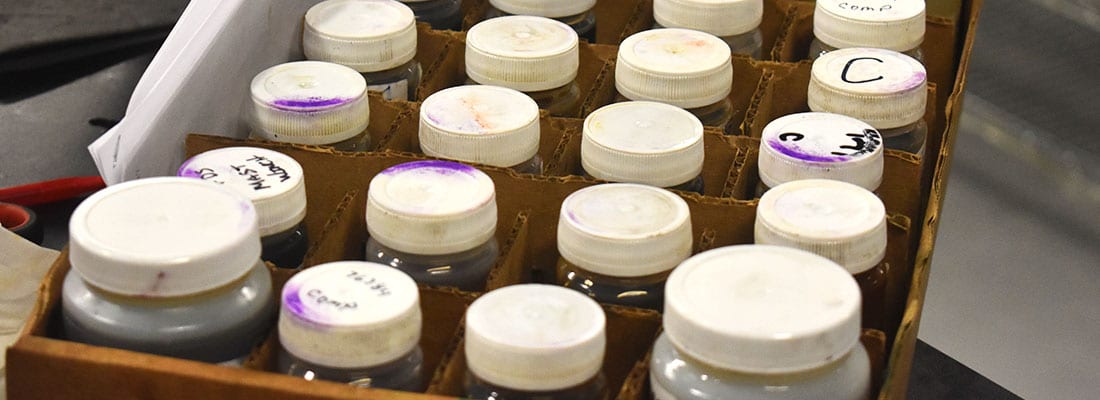 Since we introduced our new 3 oz. sample jar that is better equipped for sampling, we’ve seen a drastic decrease in leaking, messy bottles arriving at our laboratory – meaning you get your results back faster.