One-Stop Shop for Maintenance Management

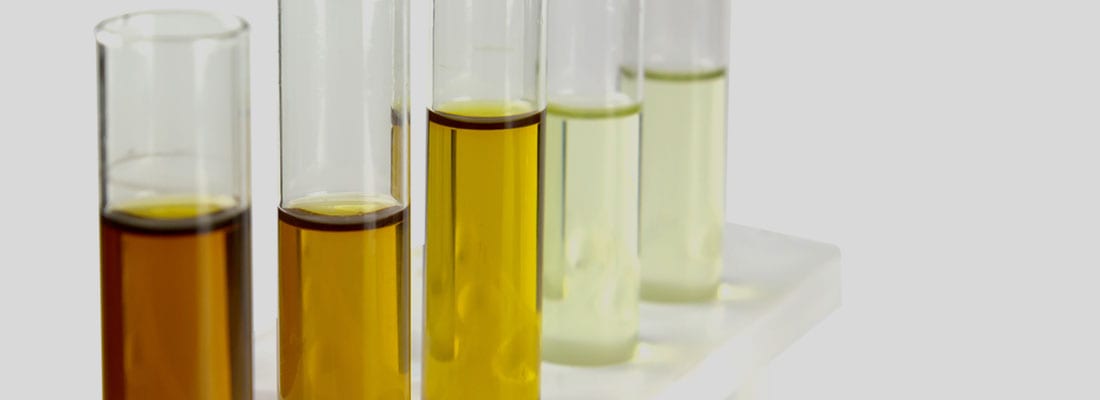
Fluid analysis data is a key component to a successful asset reliability and maintenance tracking program. Do you and your maintenance team feel the frustration of accessing multiple systems just to manage your fluid analysis data and equipment information? Is utilizing multiple systems for program management starting to cause inefficiencies resulting in lost production time for your team? Looking for a one-stop shop for accessing and managing your equipment maintenance that will save you time and money?
The solution: DataConnect
This advanced solution allows all of your HORIZON® sample data to be automatically imported into your internal maintenance tracking program. By doing this, frustration, inconveniences and inefficient practices are eliminated. Organize your equipment data, submit samples and evaluate the testing results – all within one system.
- Increase visibility
- React quickly to high severity results
- Cut maintenance costs
- Prove the value of fluid analysis to leadership
Contact us for more information on how to set up DataConnect for your fluid analysis program!
Proven Impact. Proven Uptime. Proven Savings.
Let us prove it to you.